Which AI image model draws an accurate chart
A chart is a test of following instructions, not aesthetics: six bars at stated heights, in order, with readable axes. We gave 36 models the same numbers and checked every label. The grid includes the September 18 additions; each model page dates its own run.

Anvisha Pai, Co-founder & CEO, Voyager
What the side-by-side shows
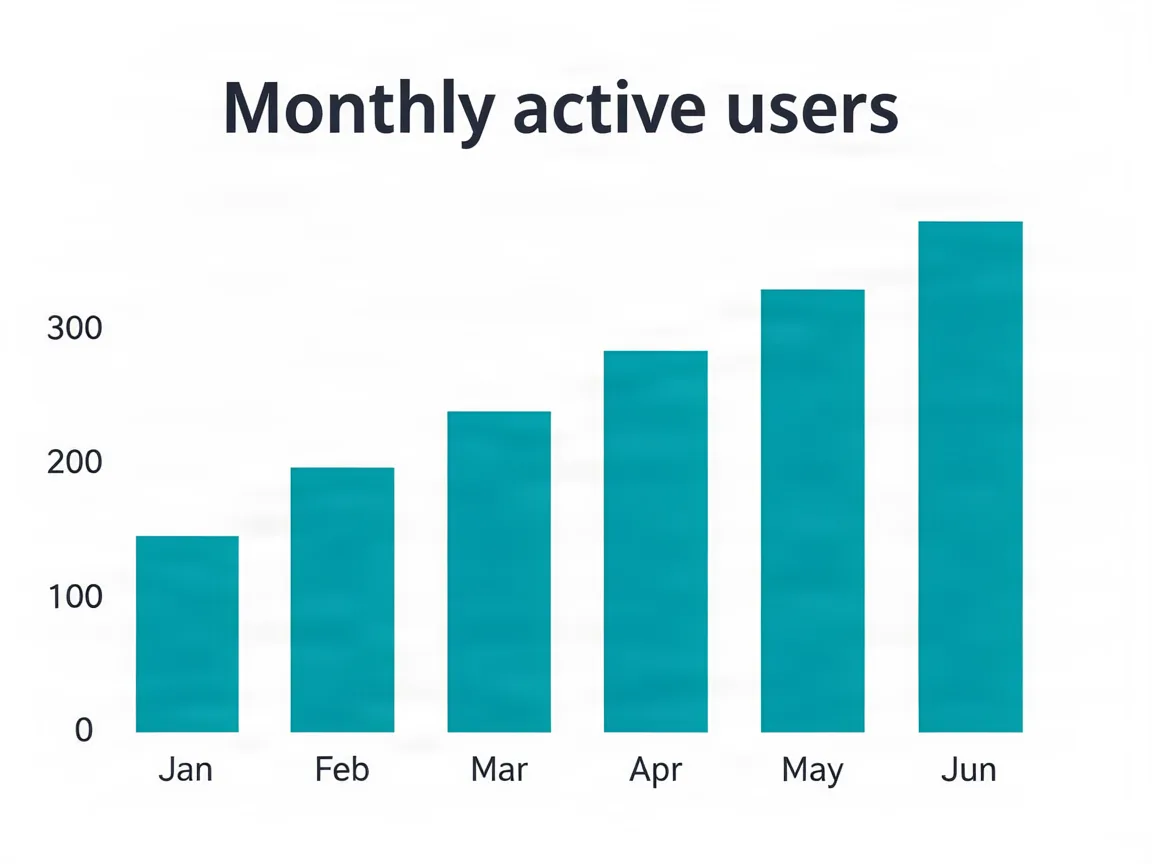
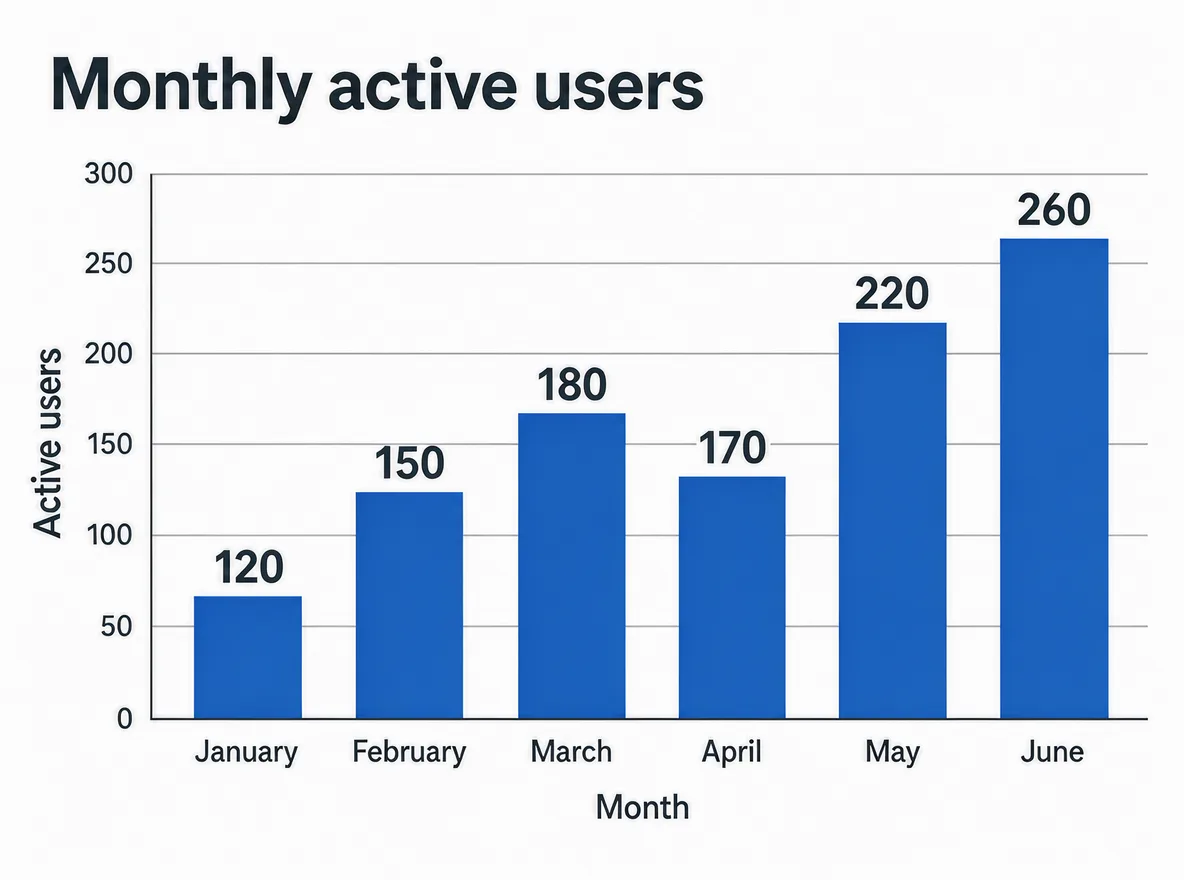
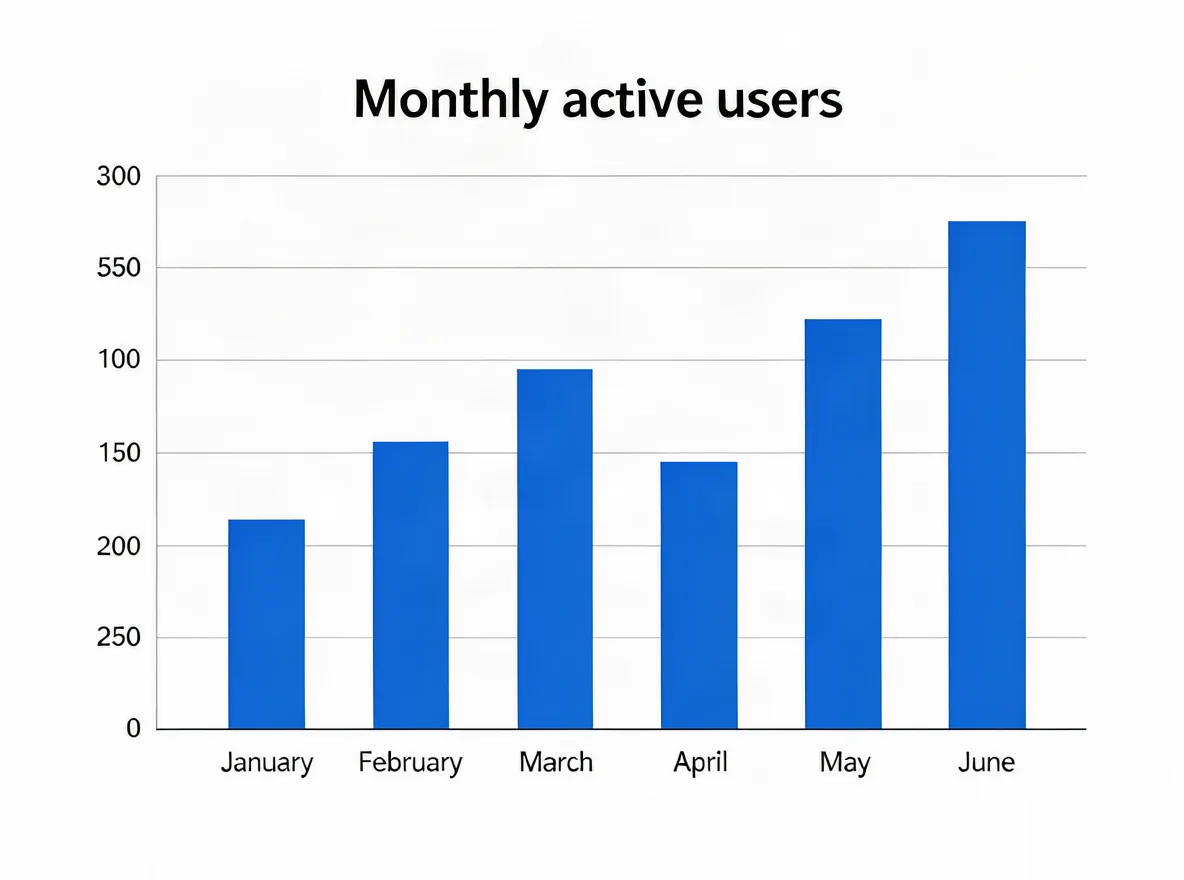
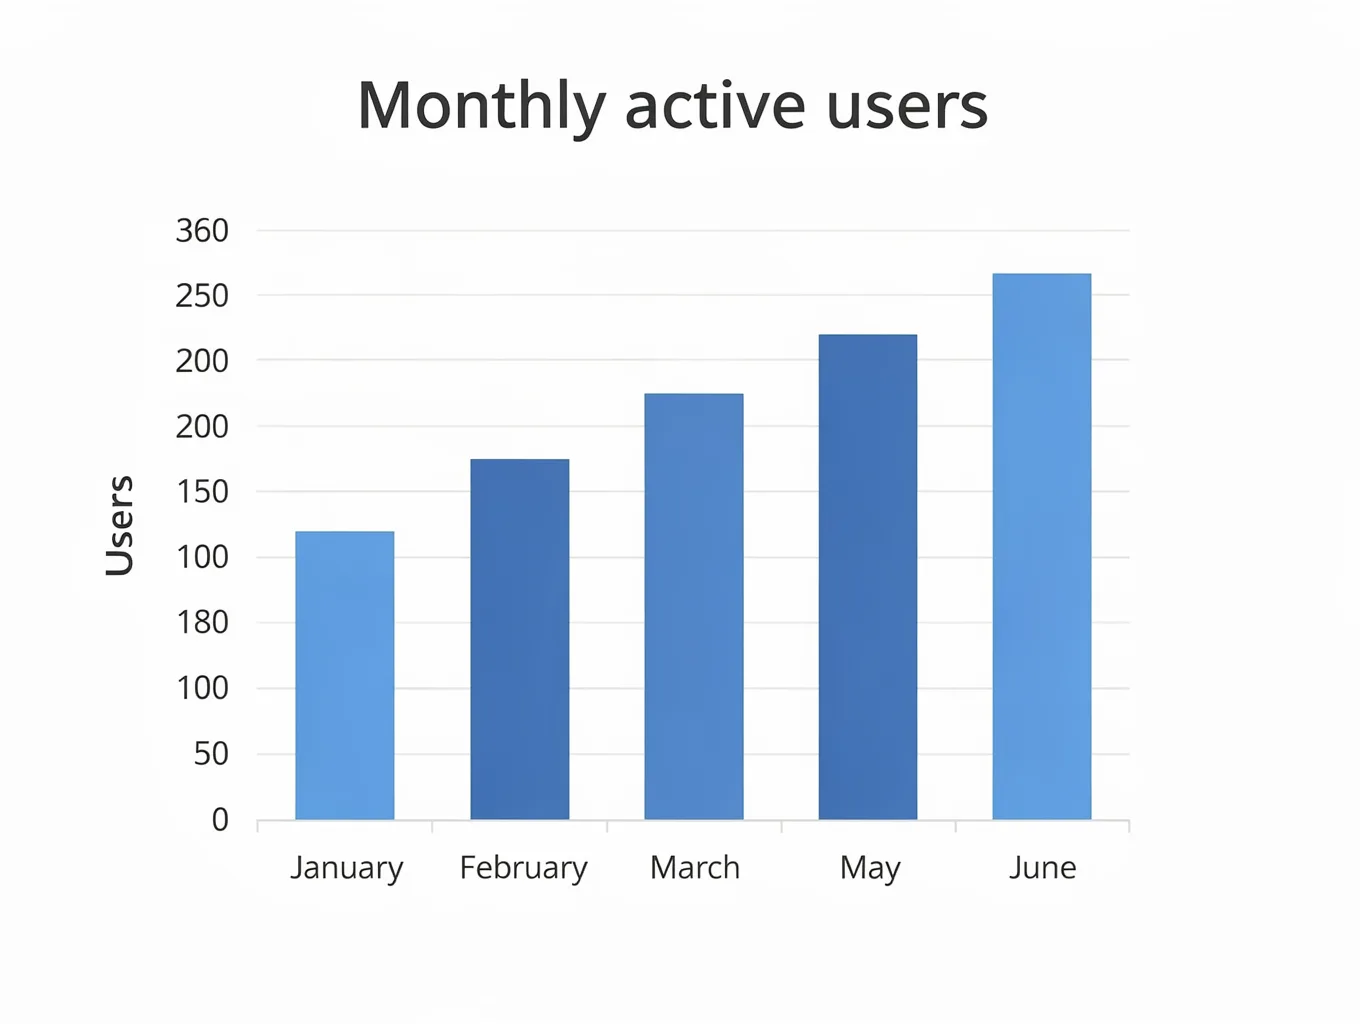
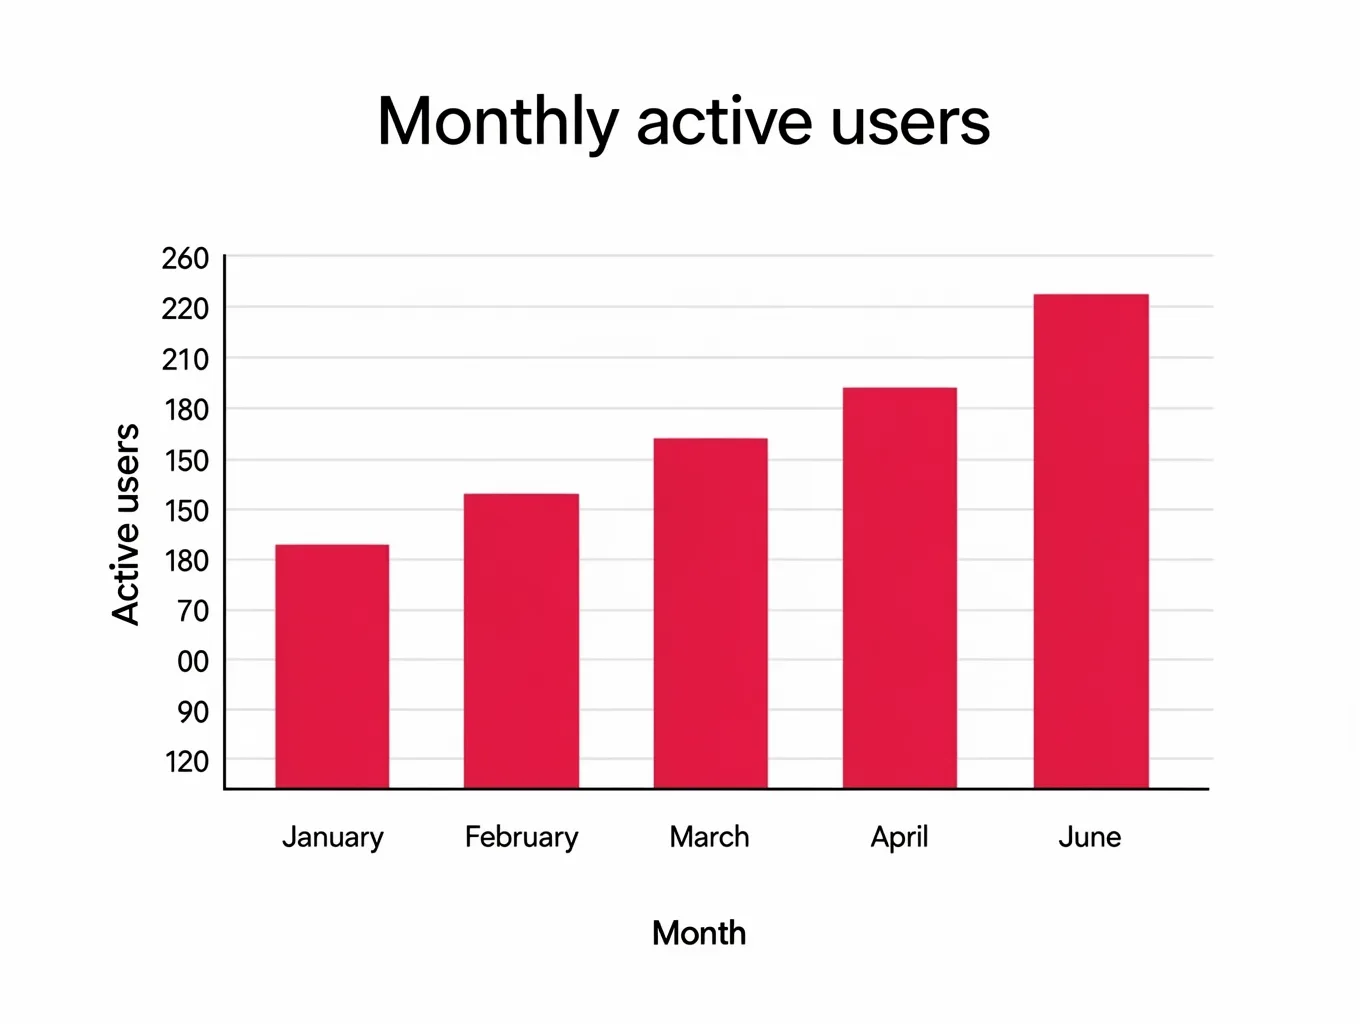
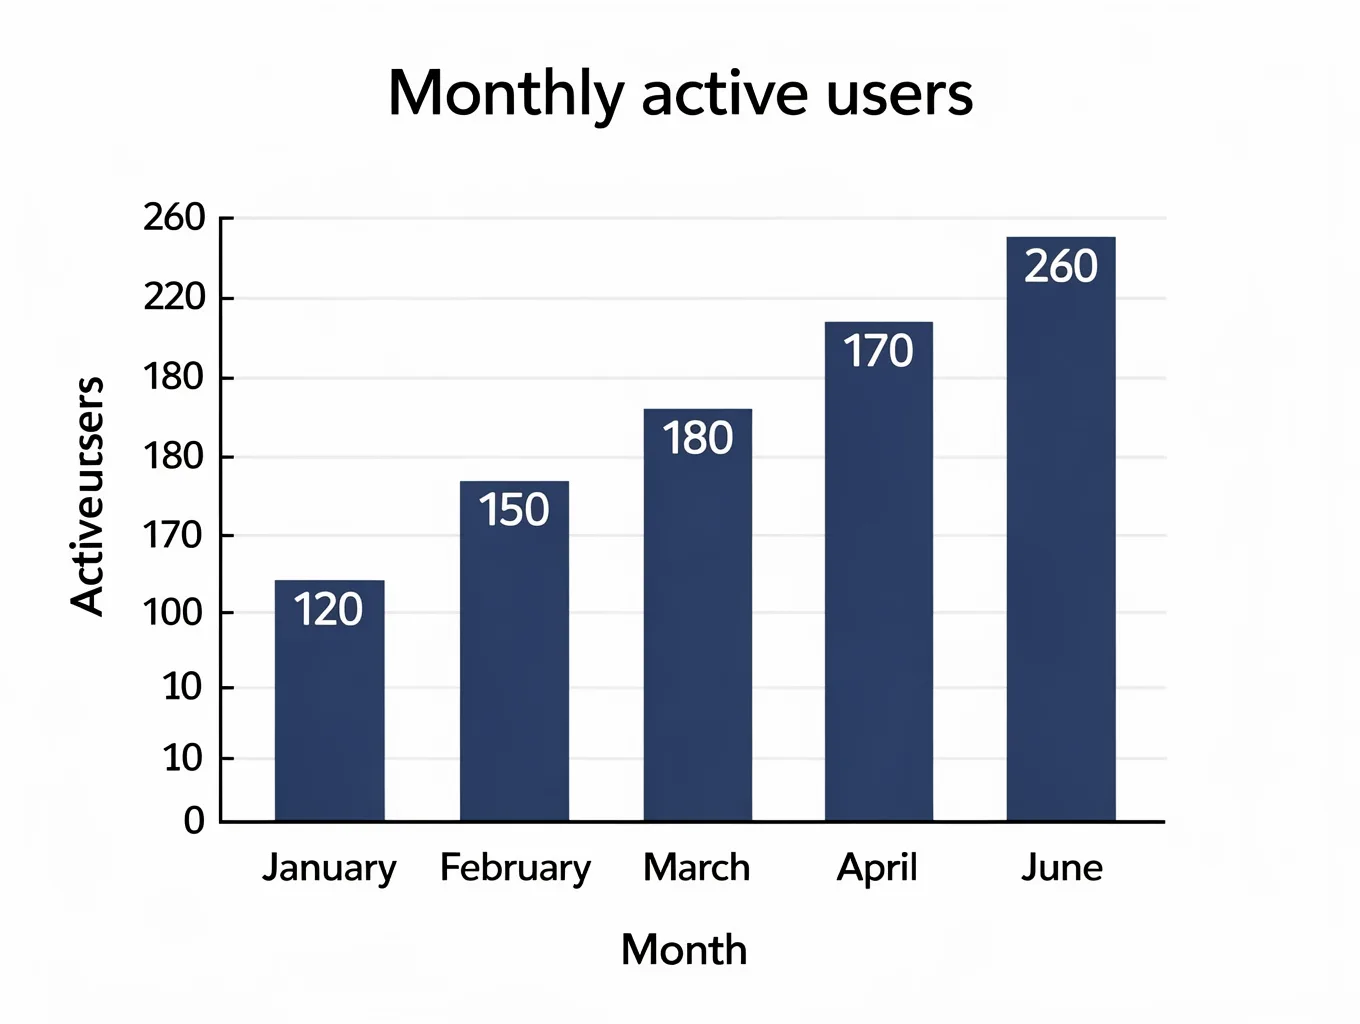
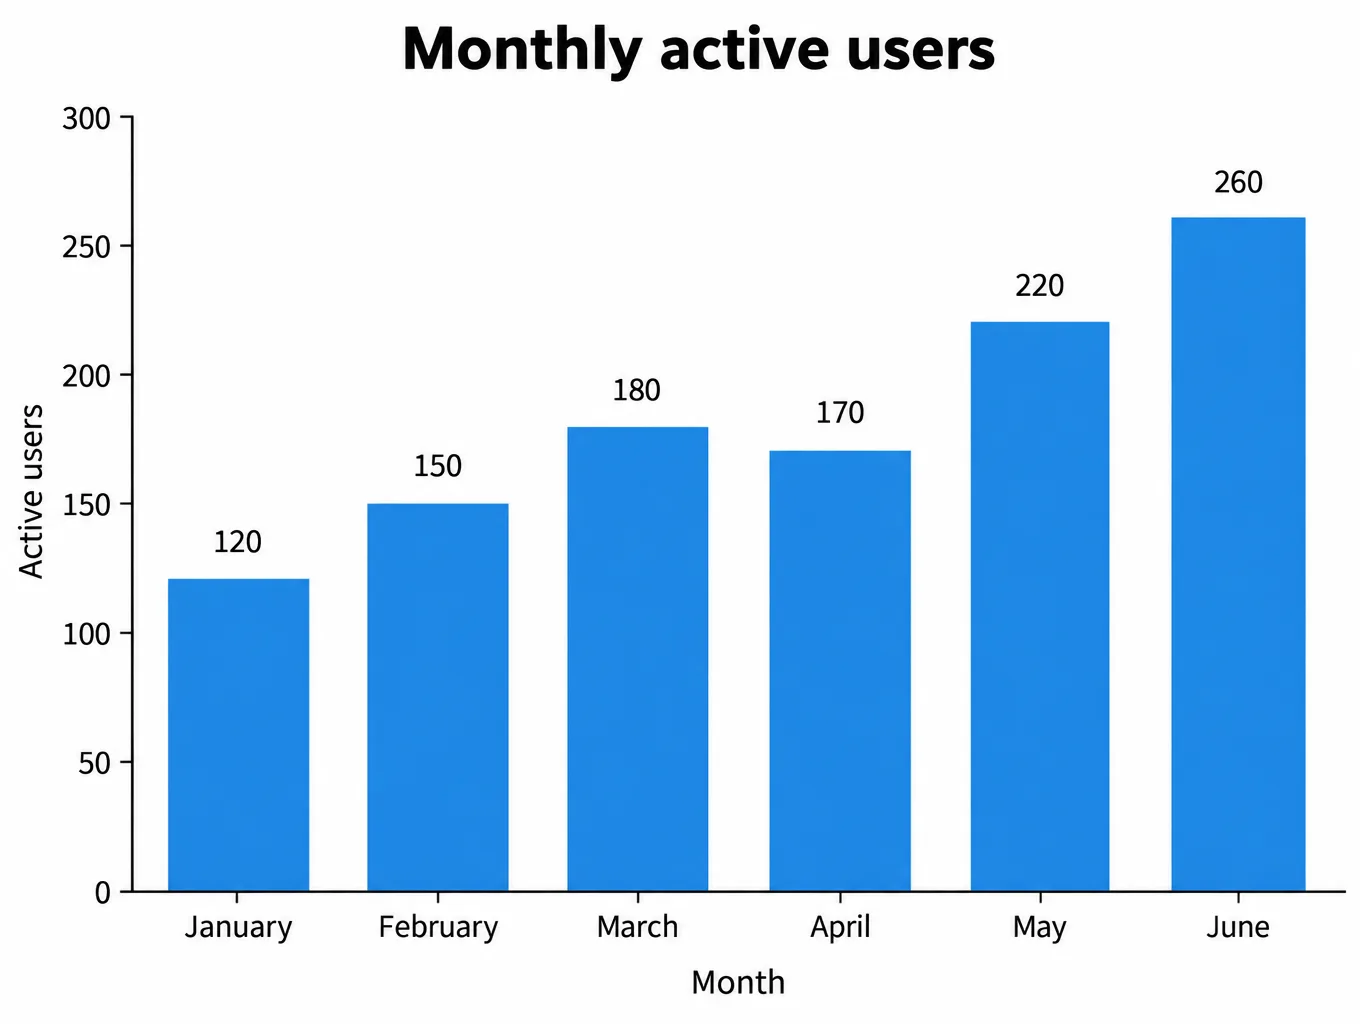
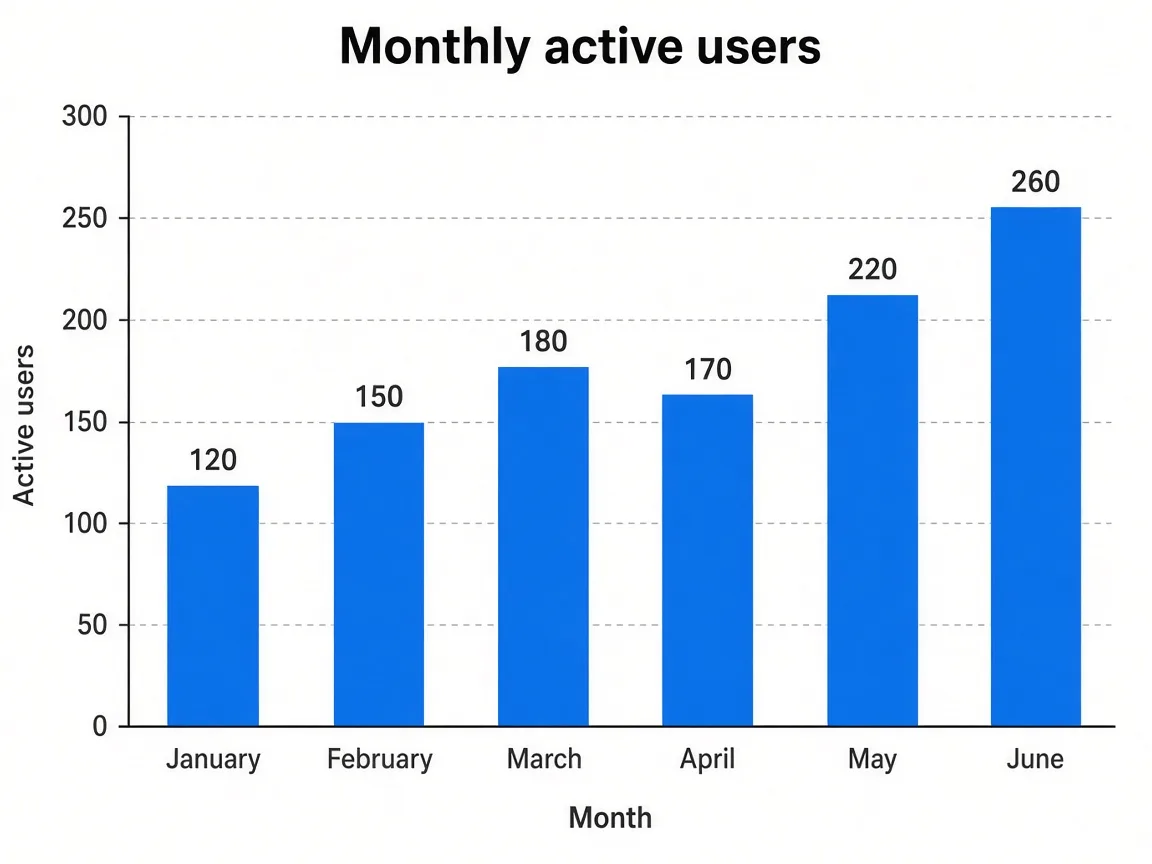
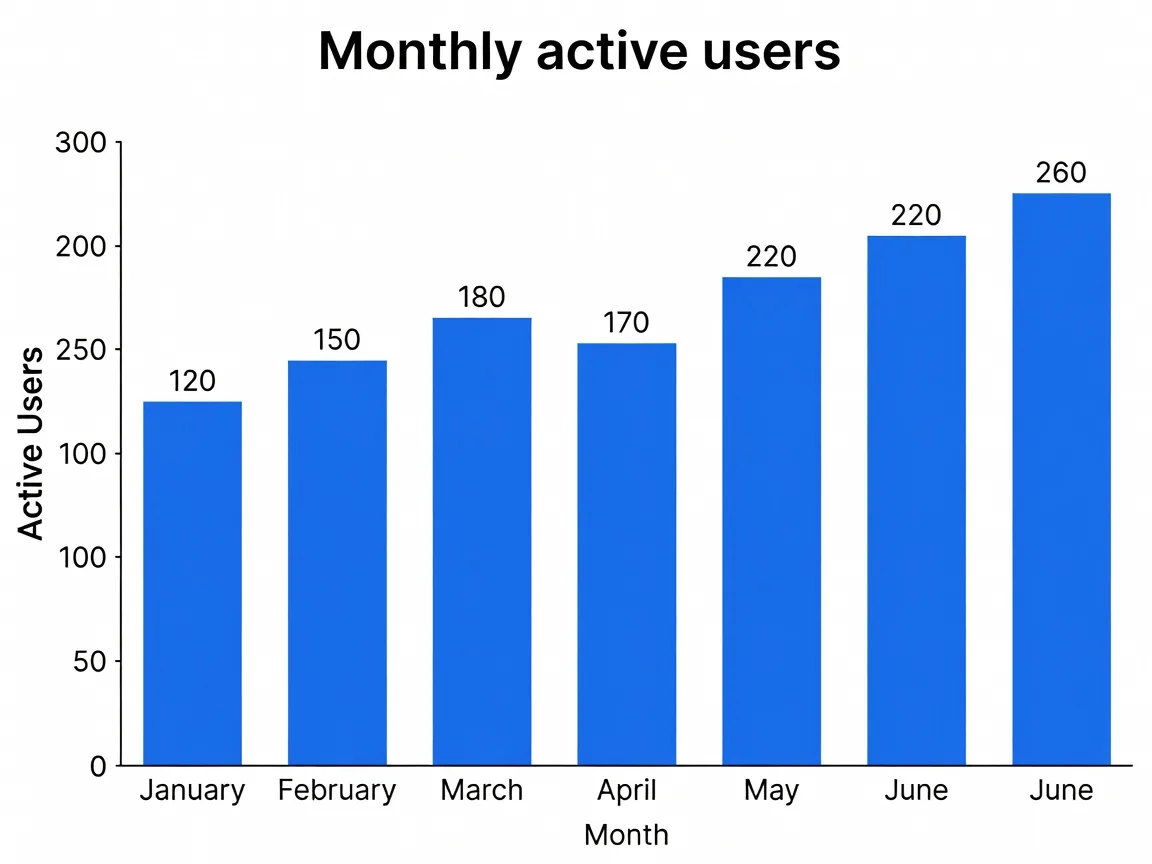
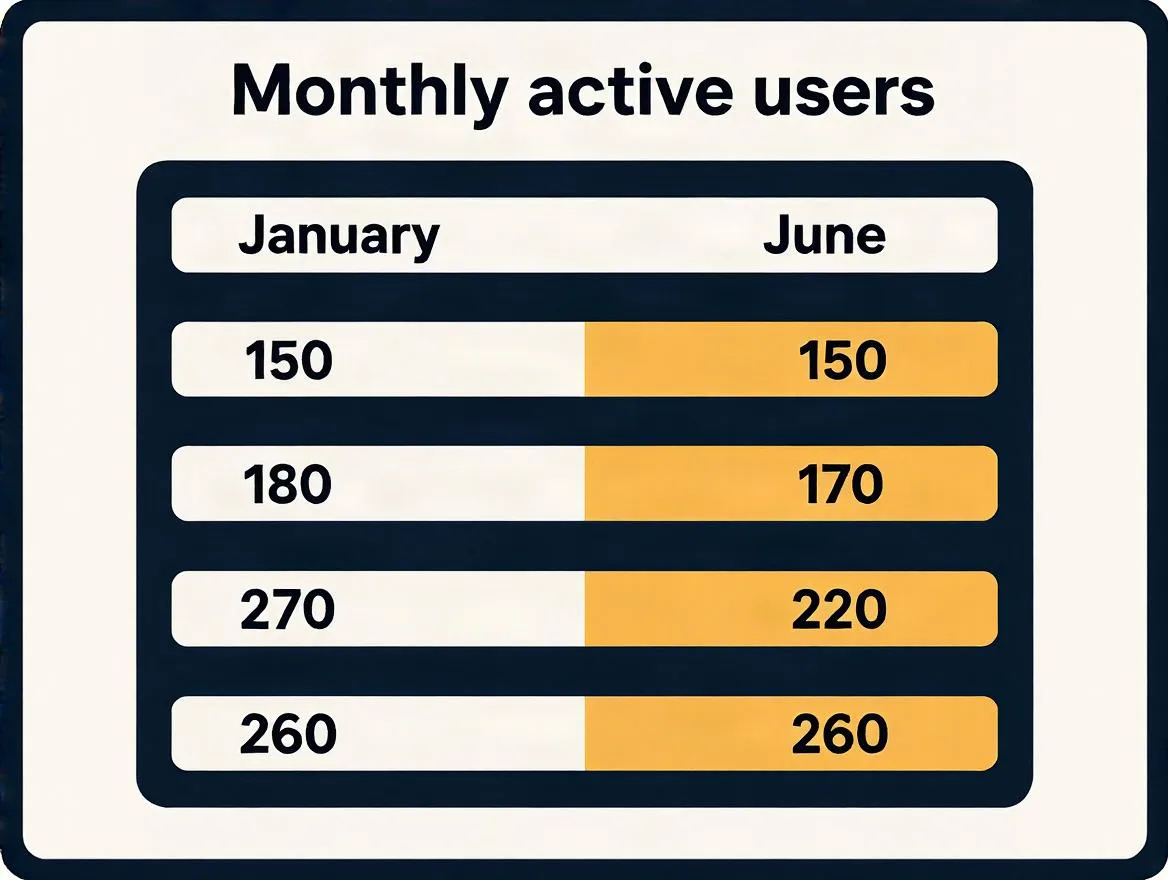
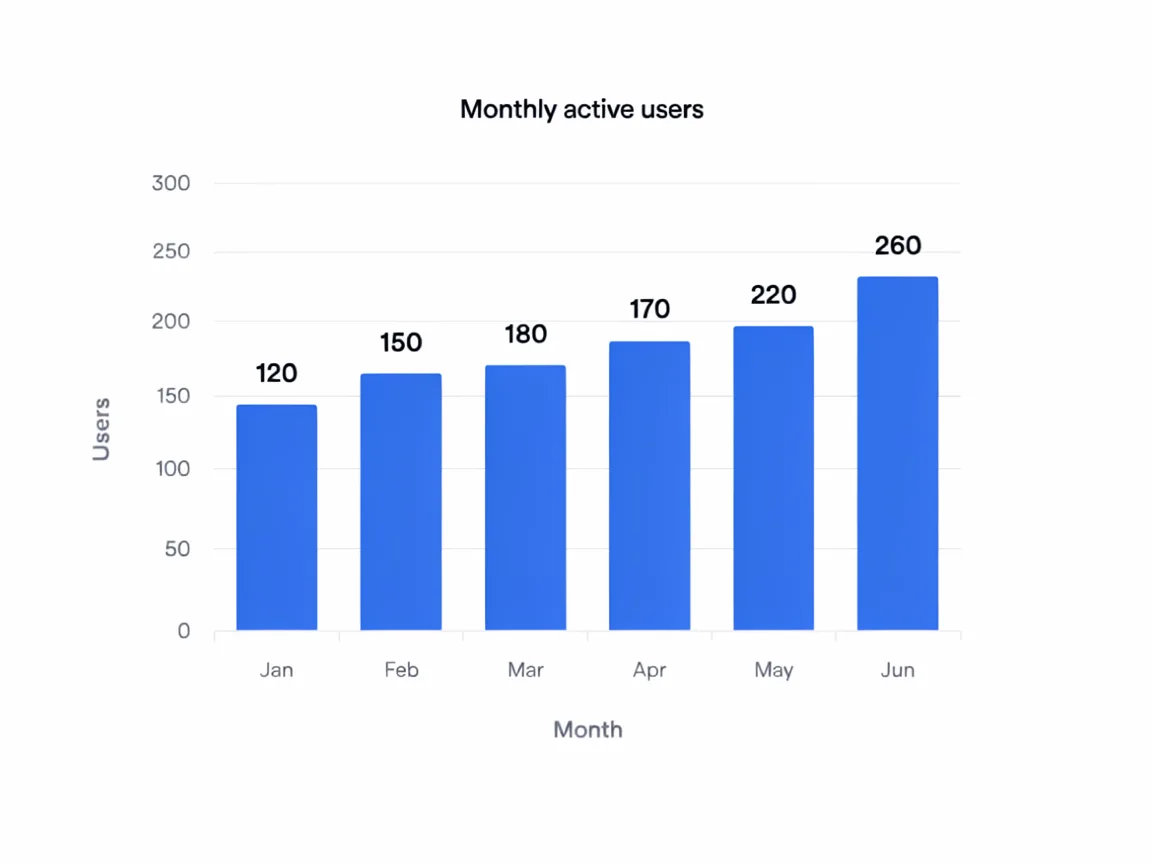
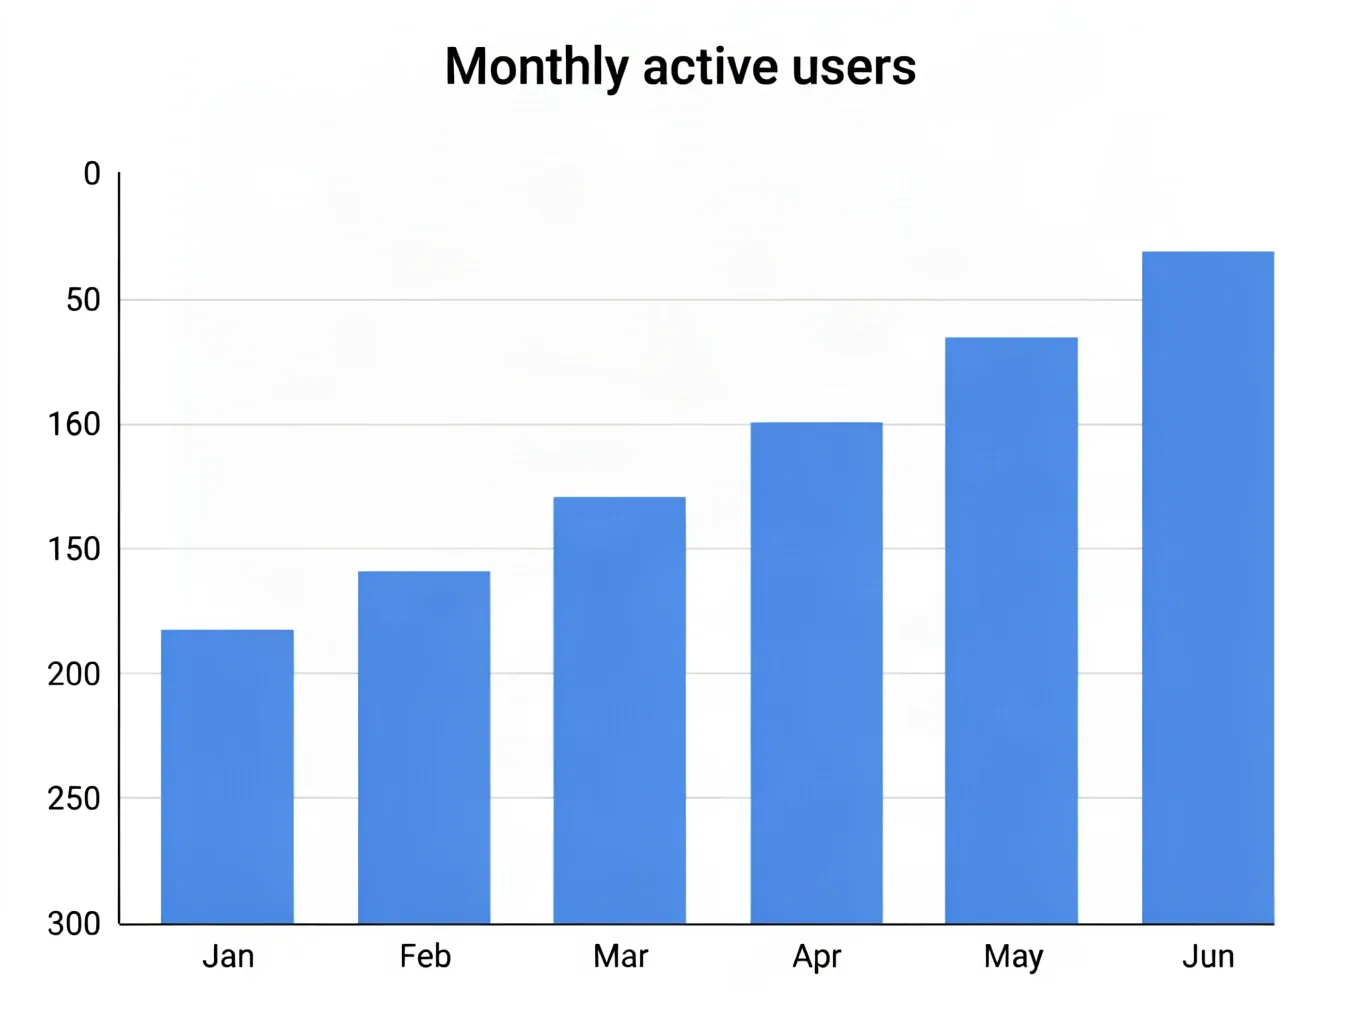
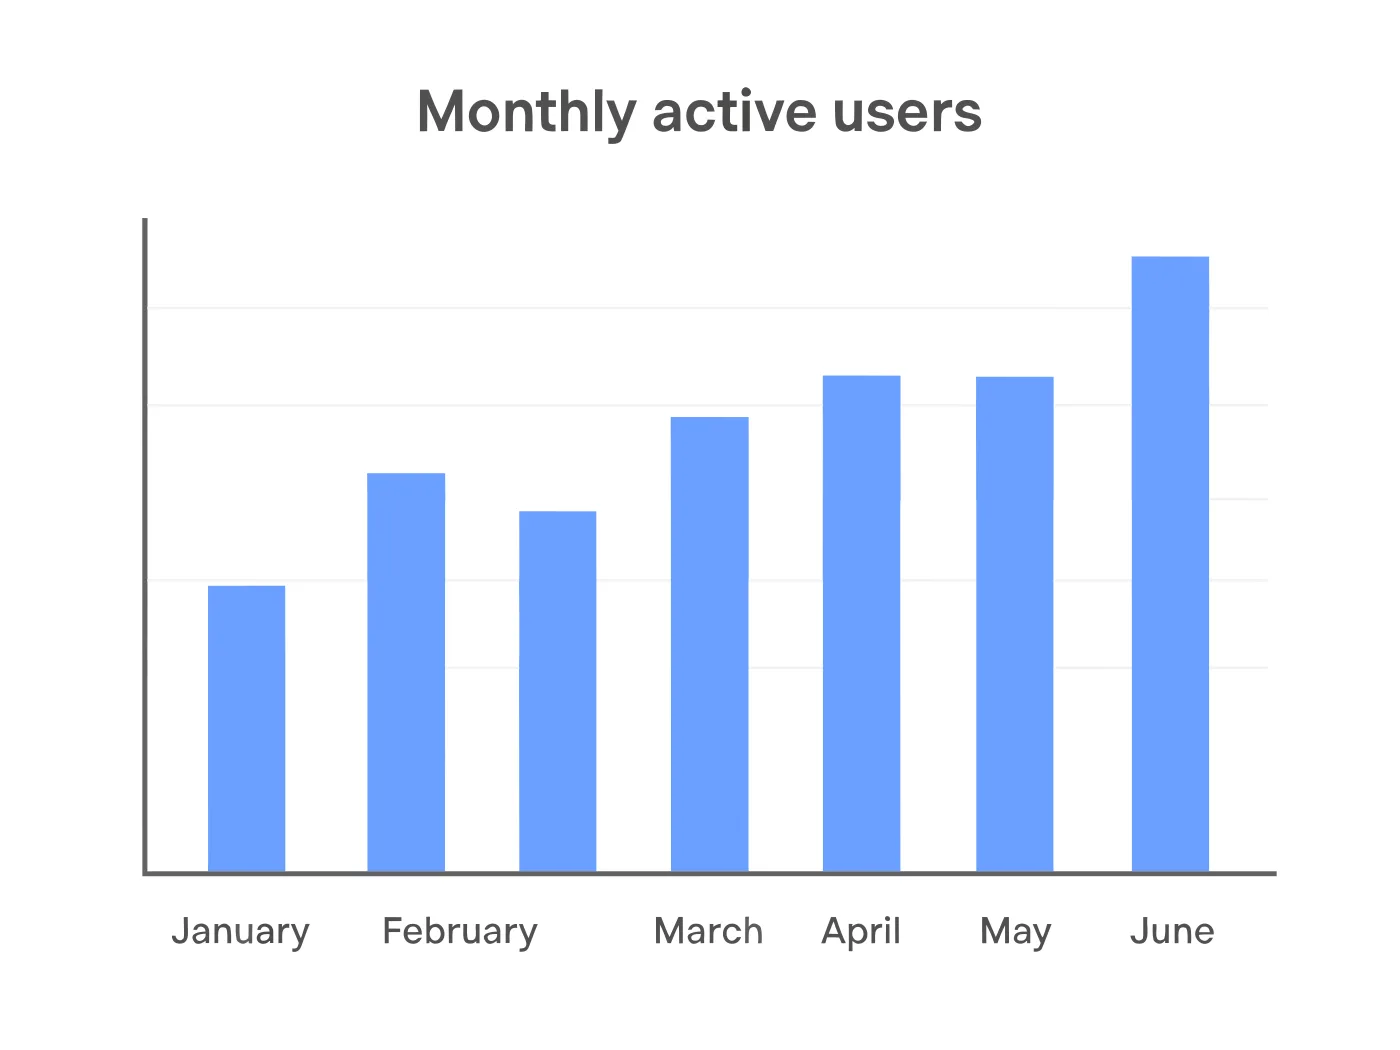
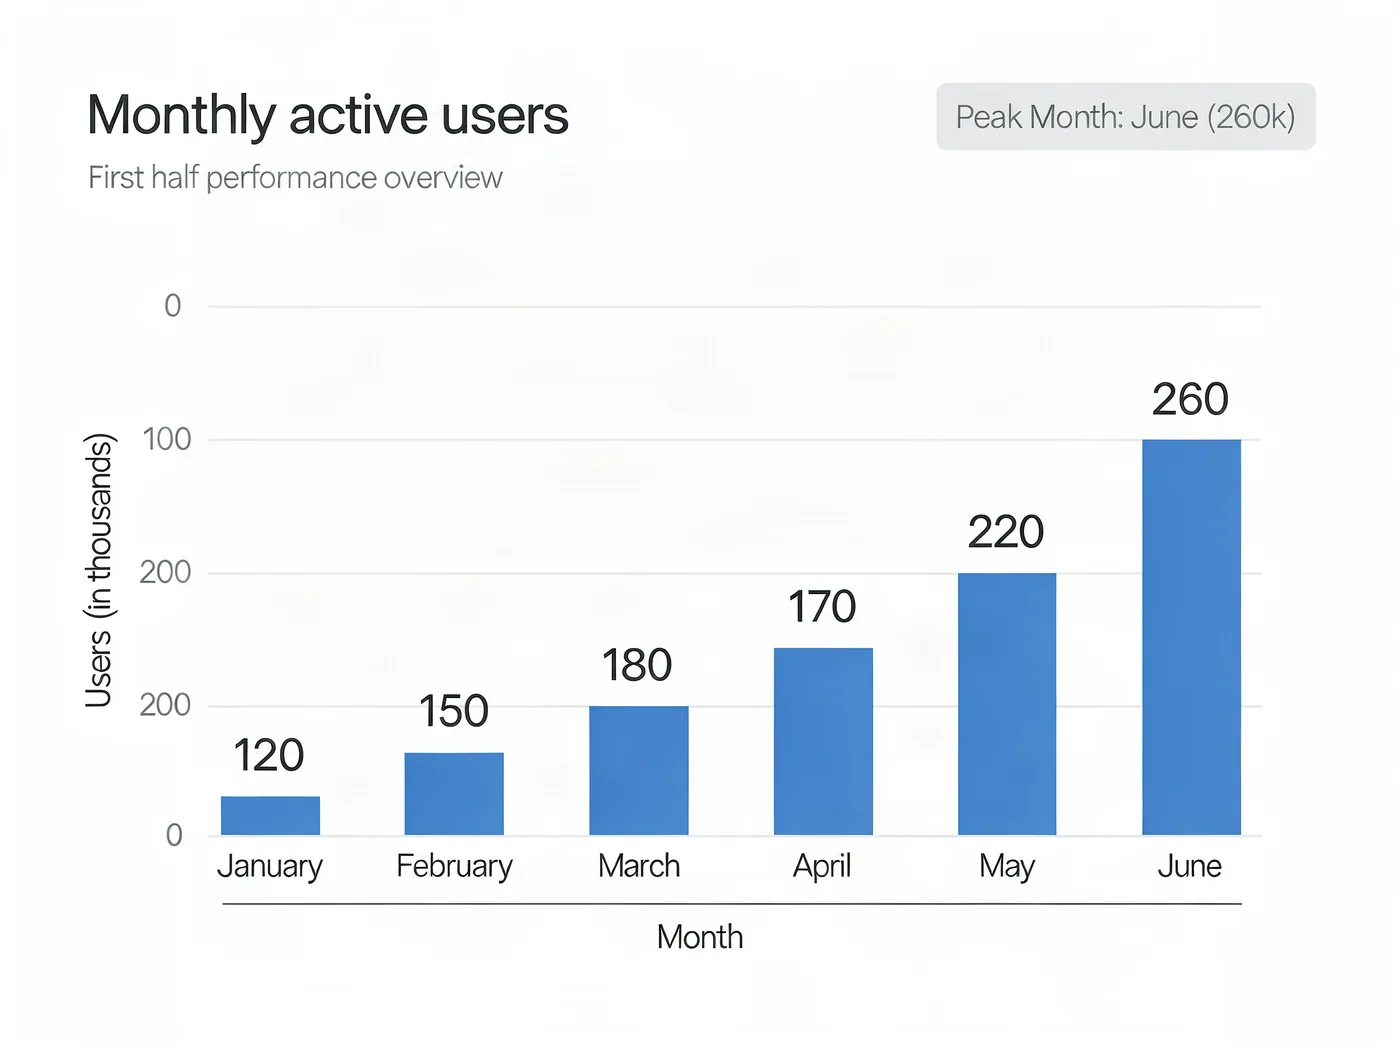
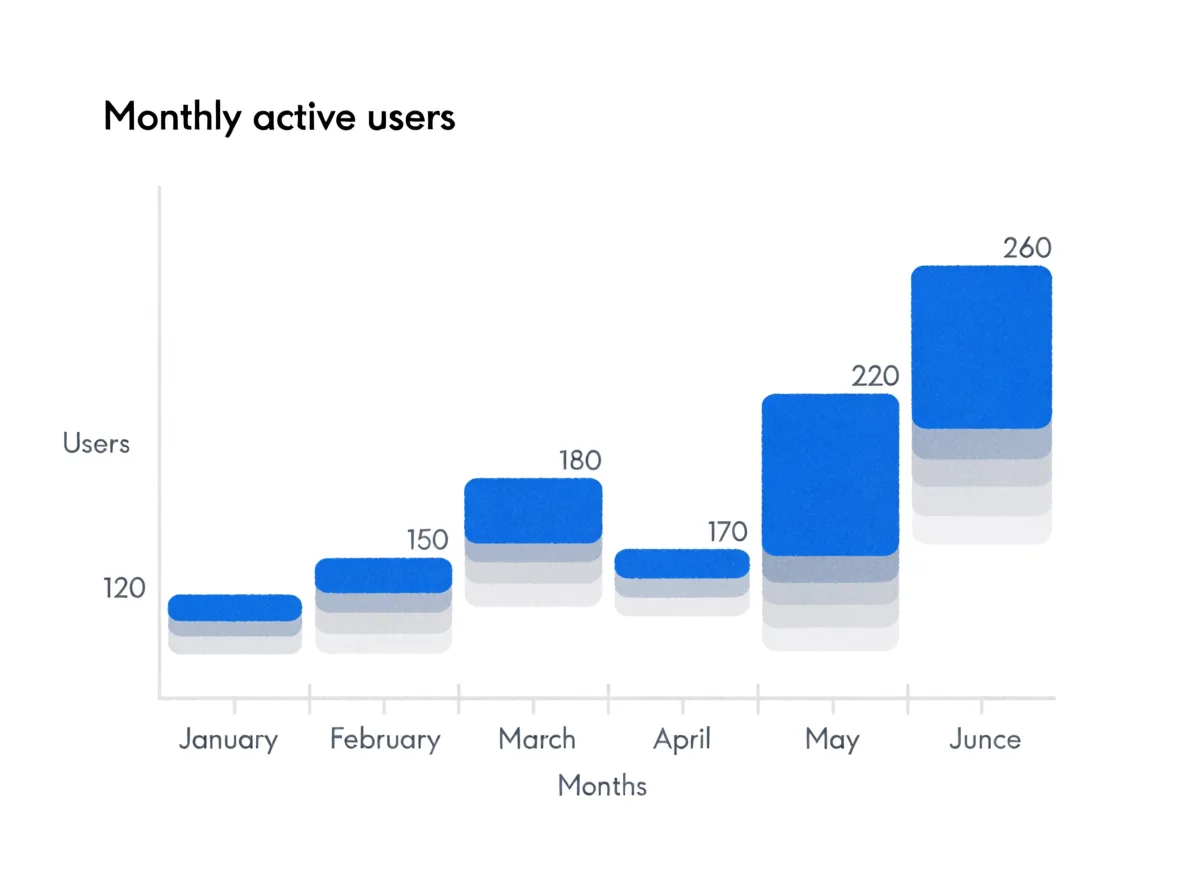
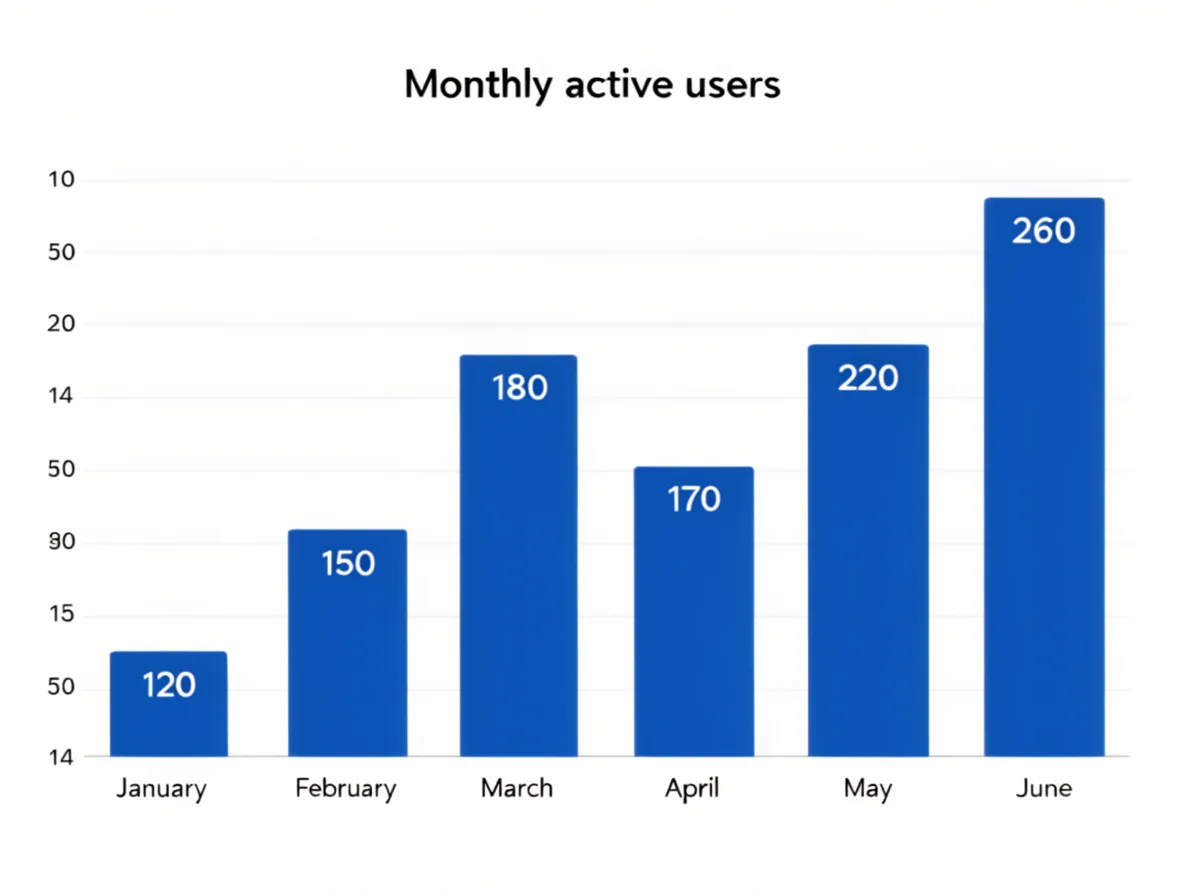
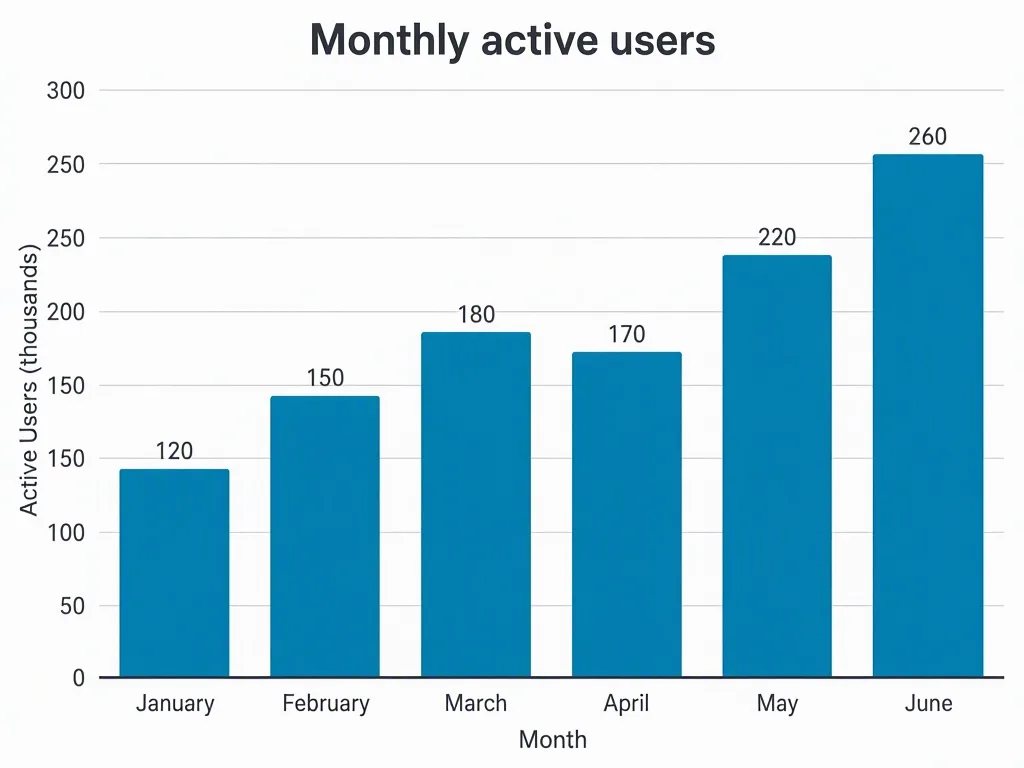
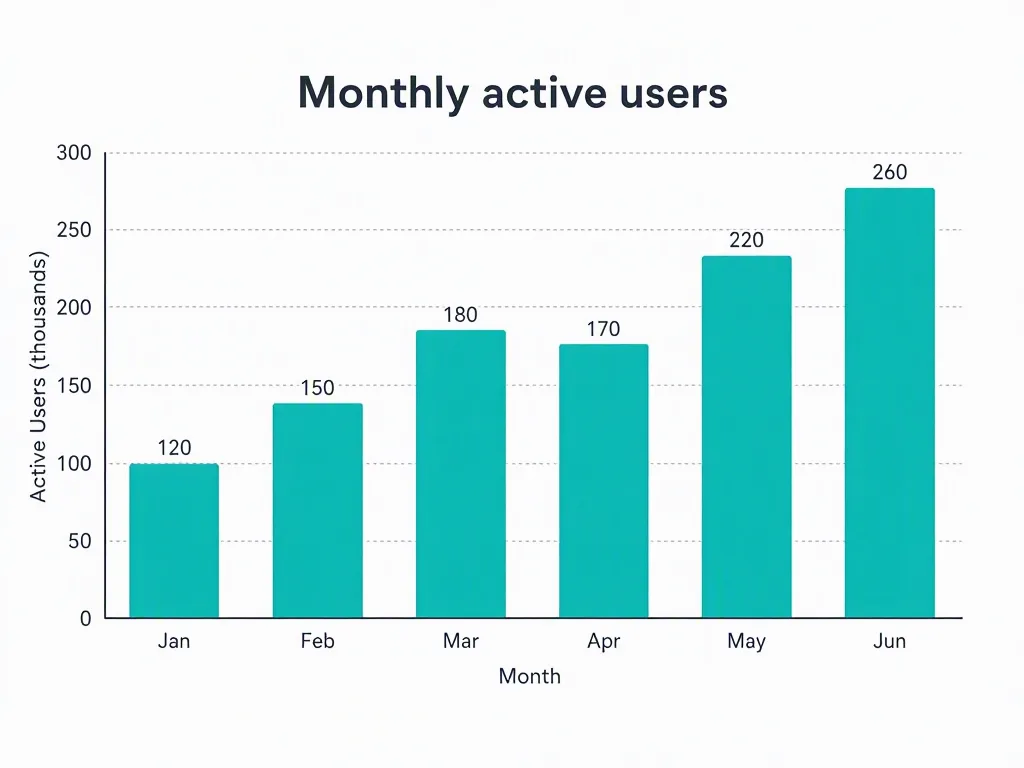
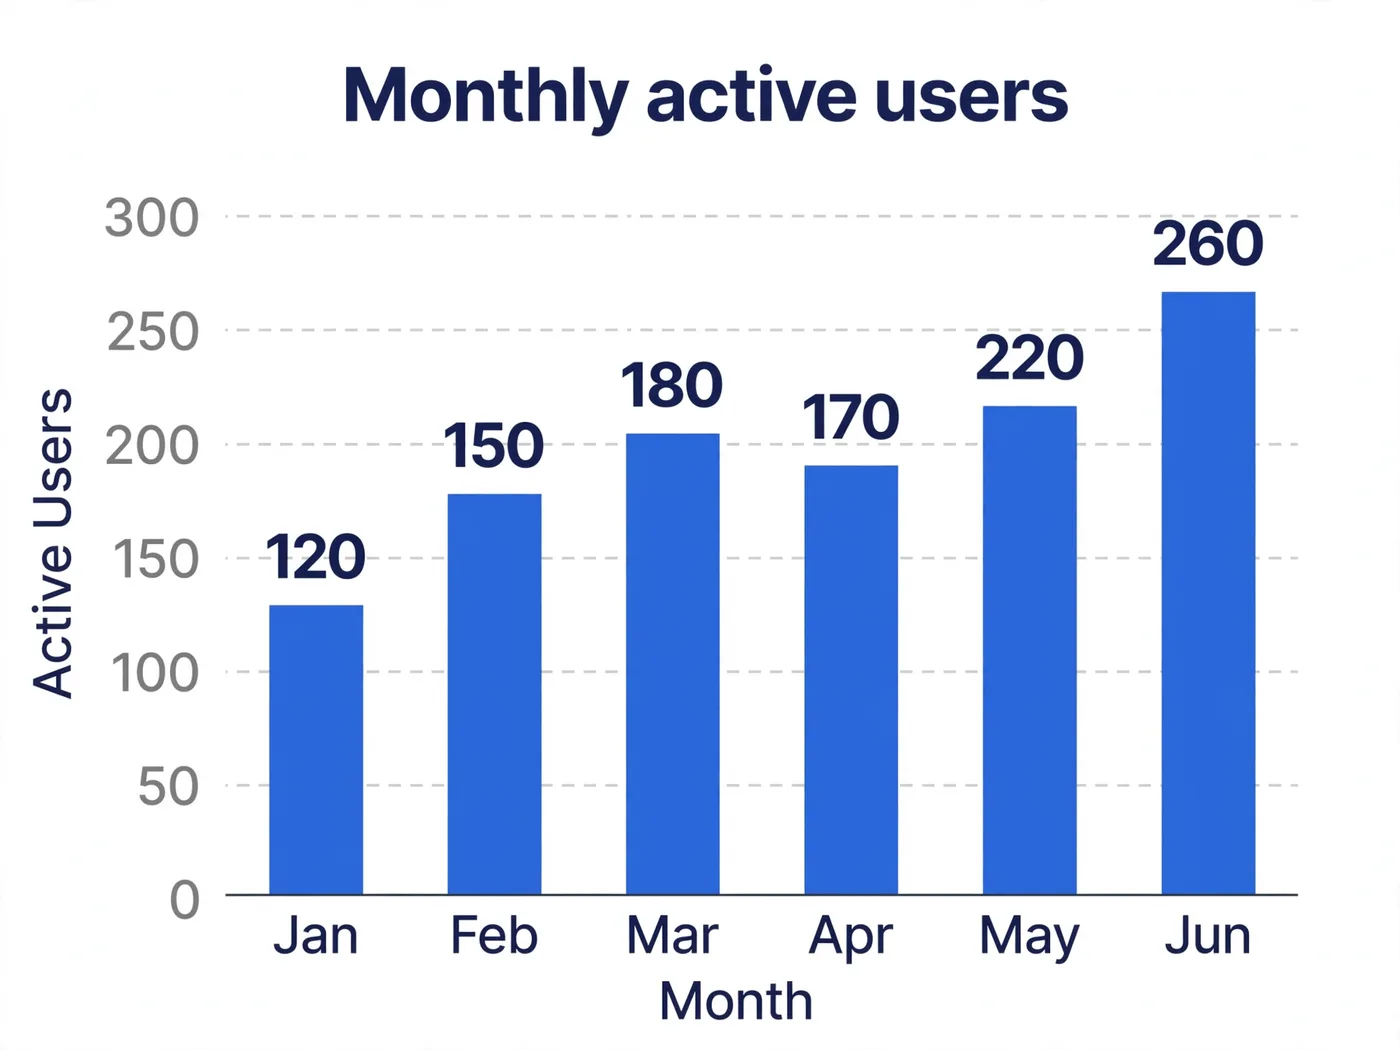
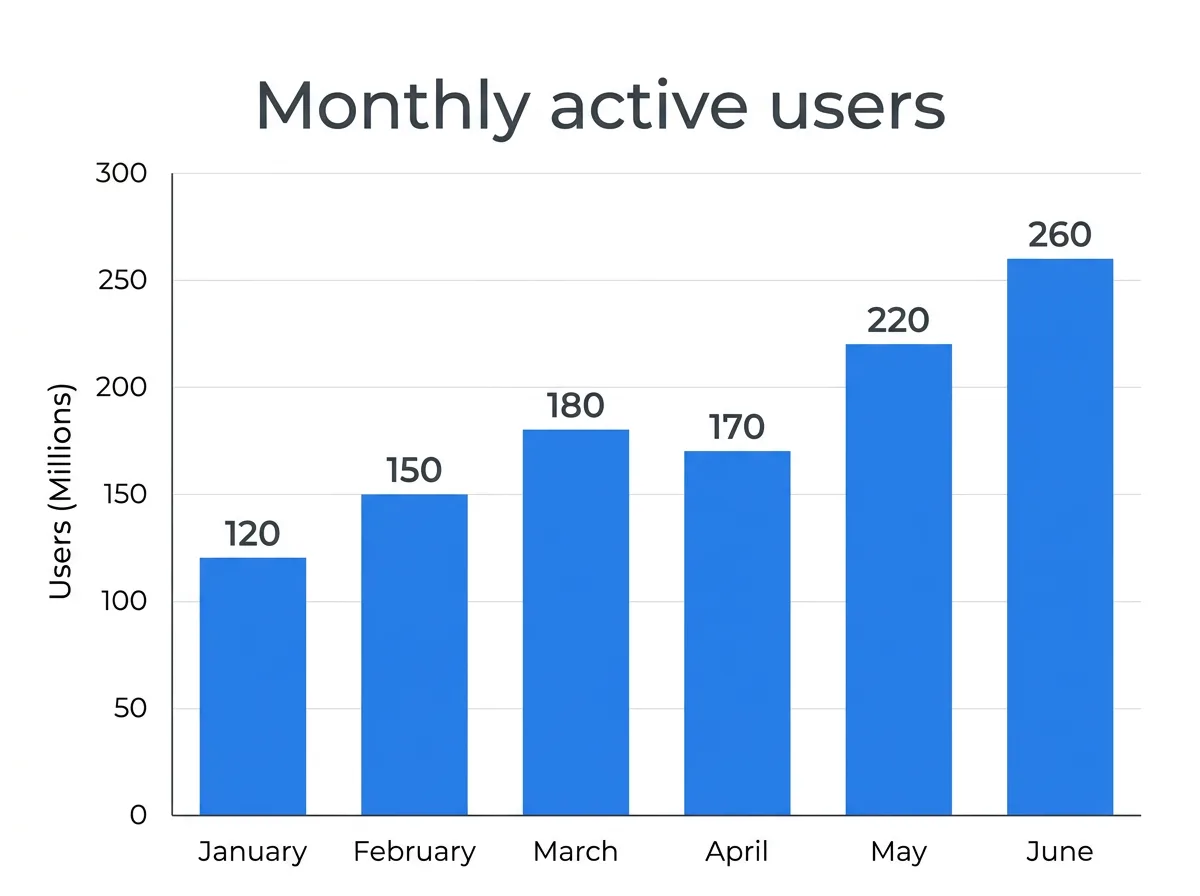
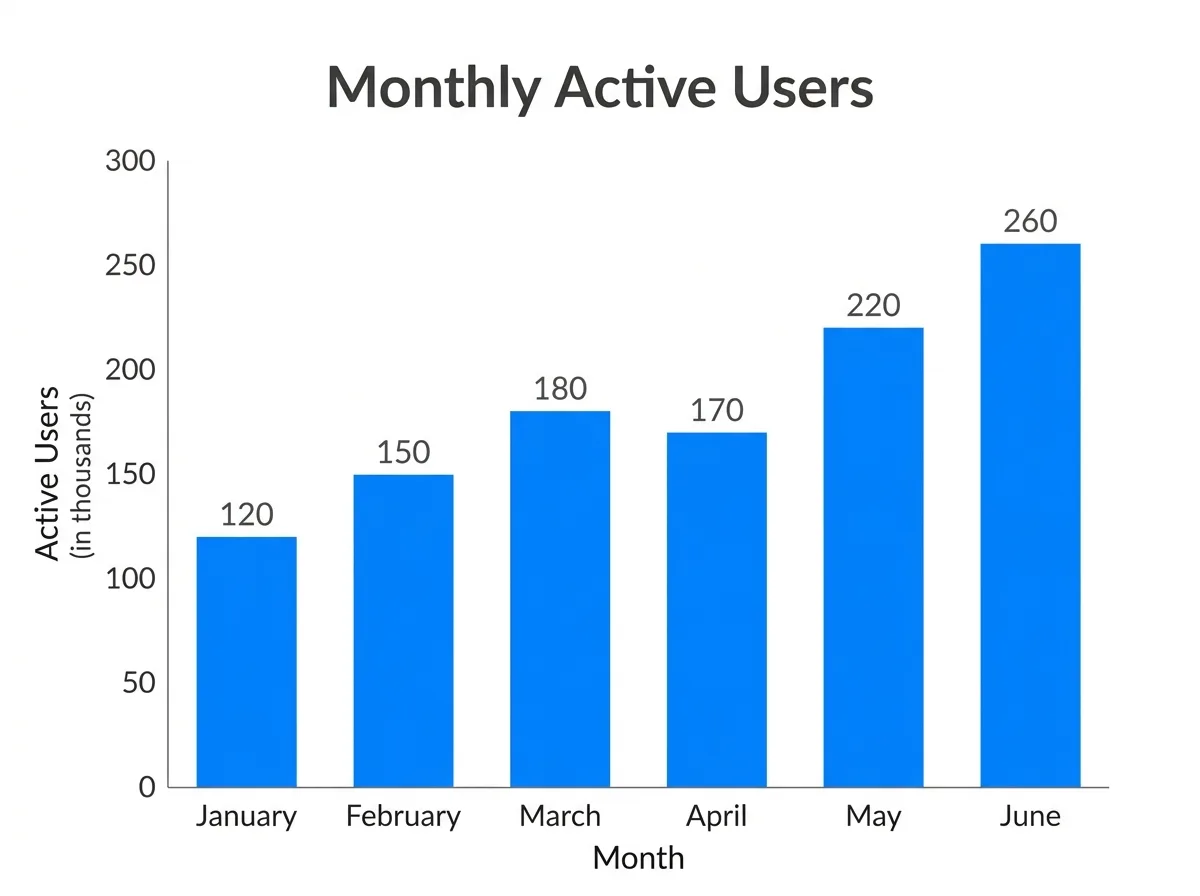
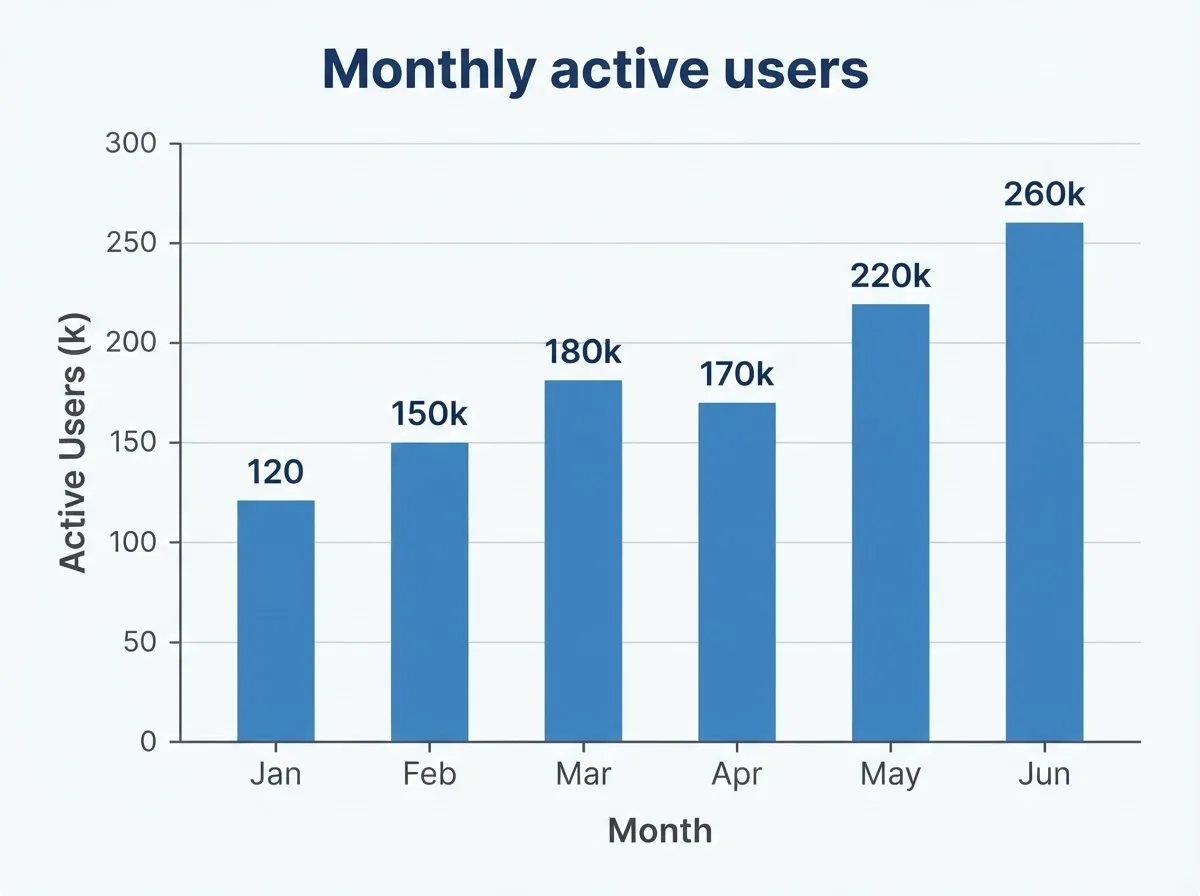
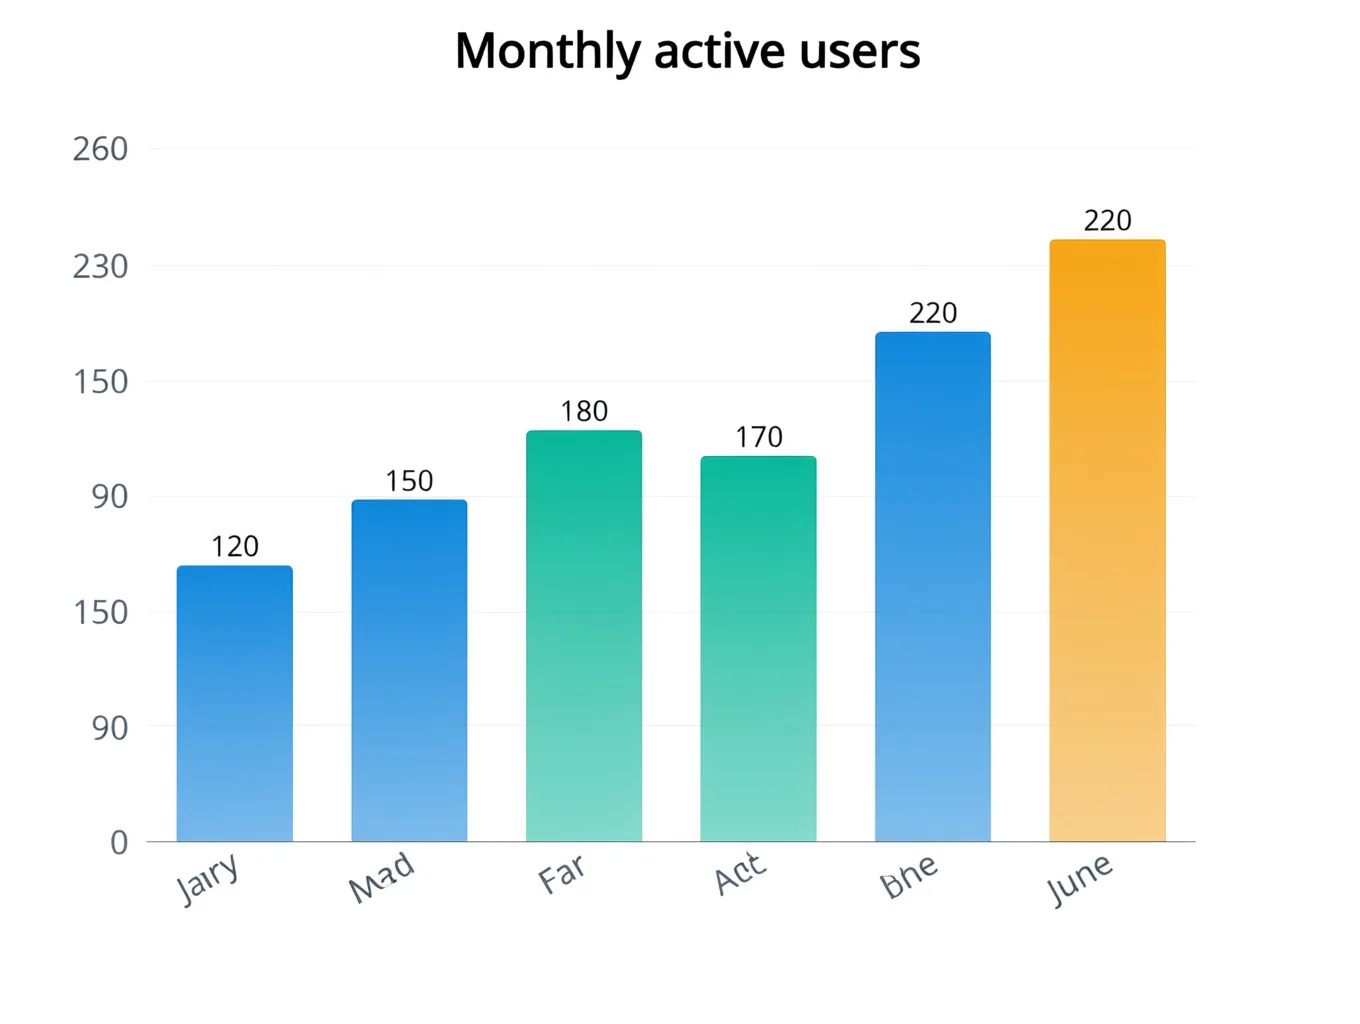
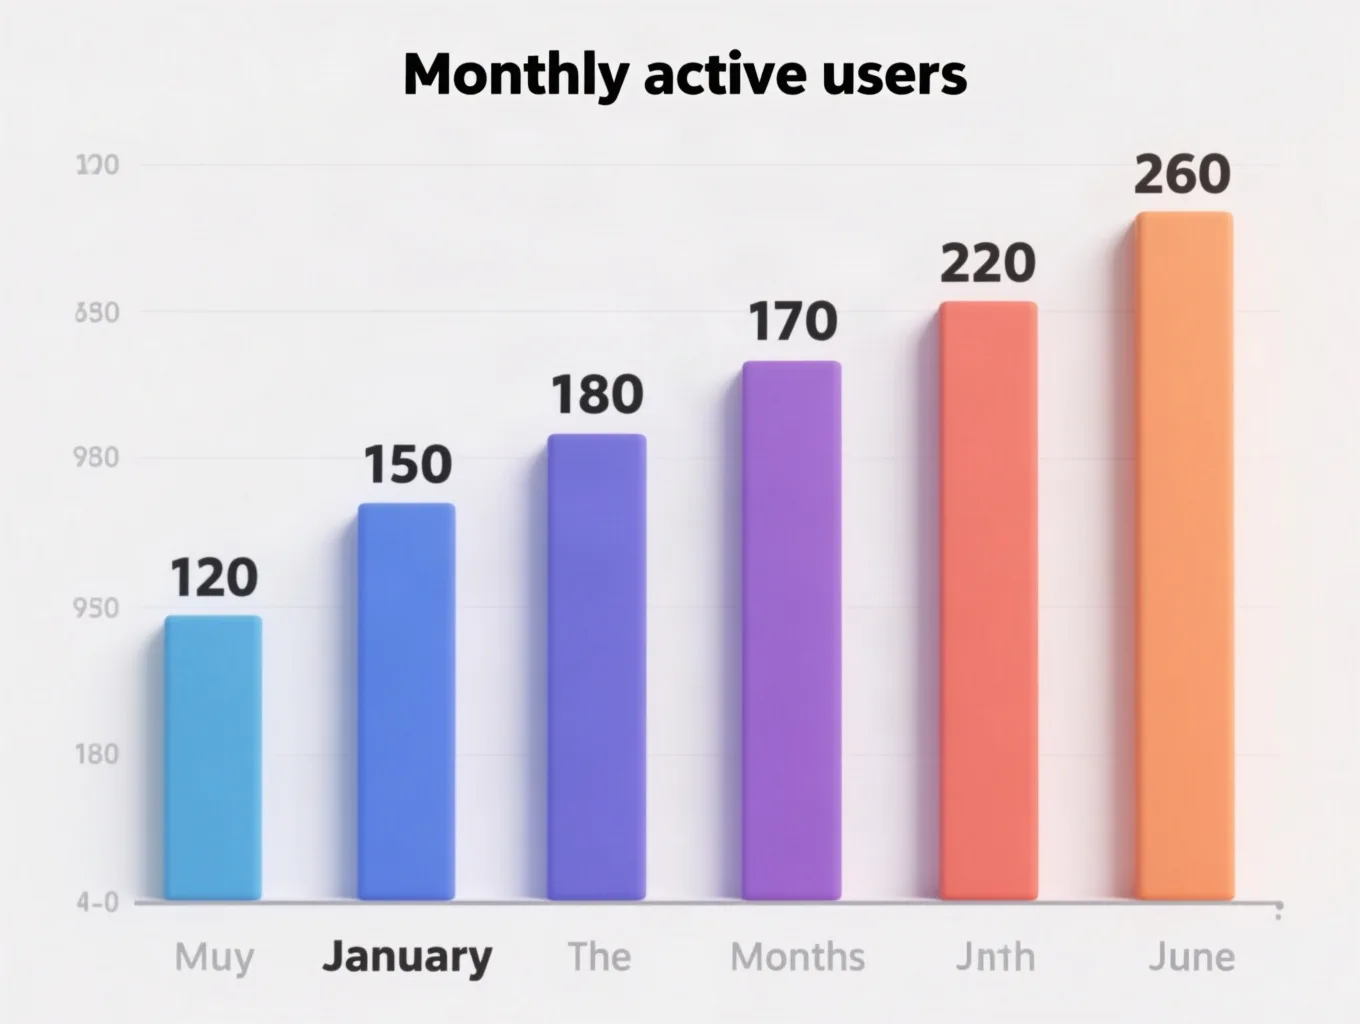
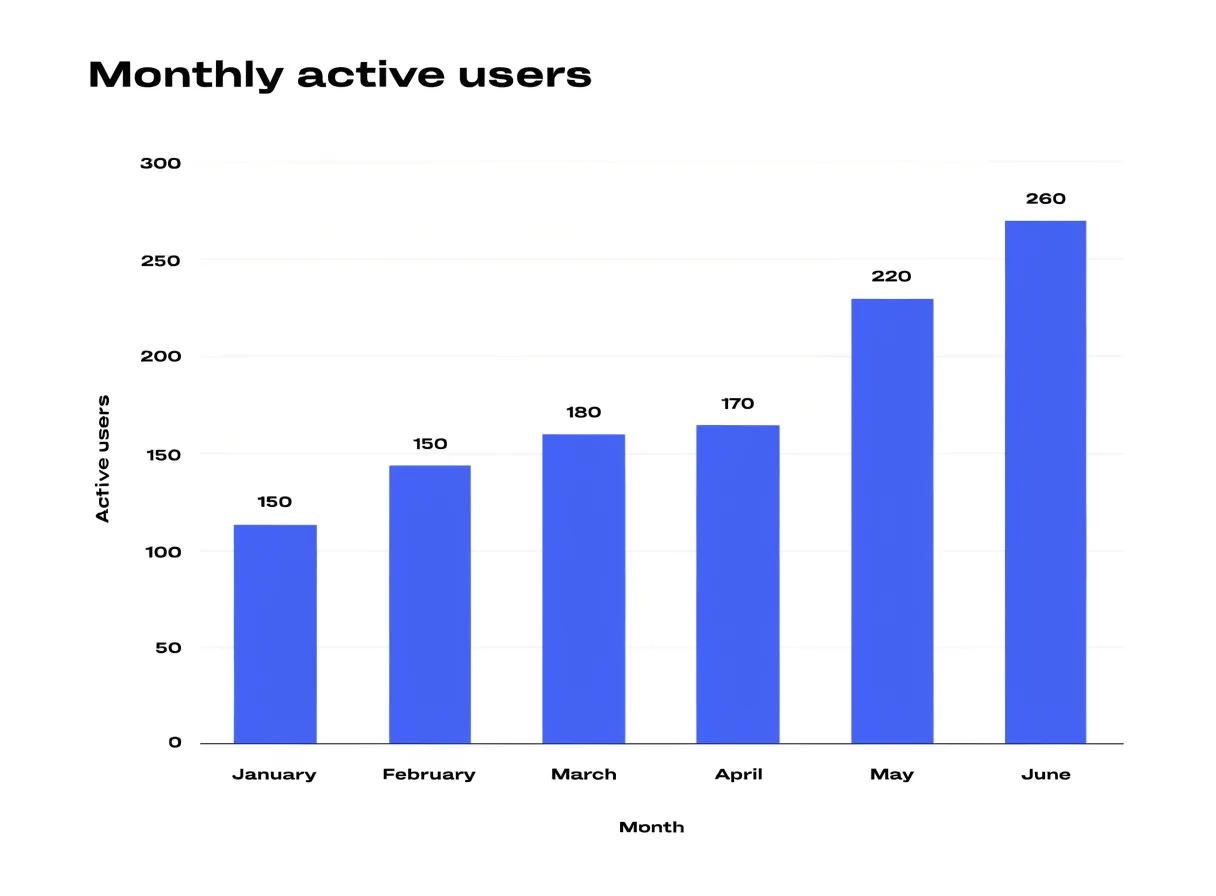
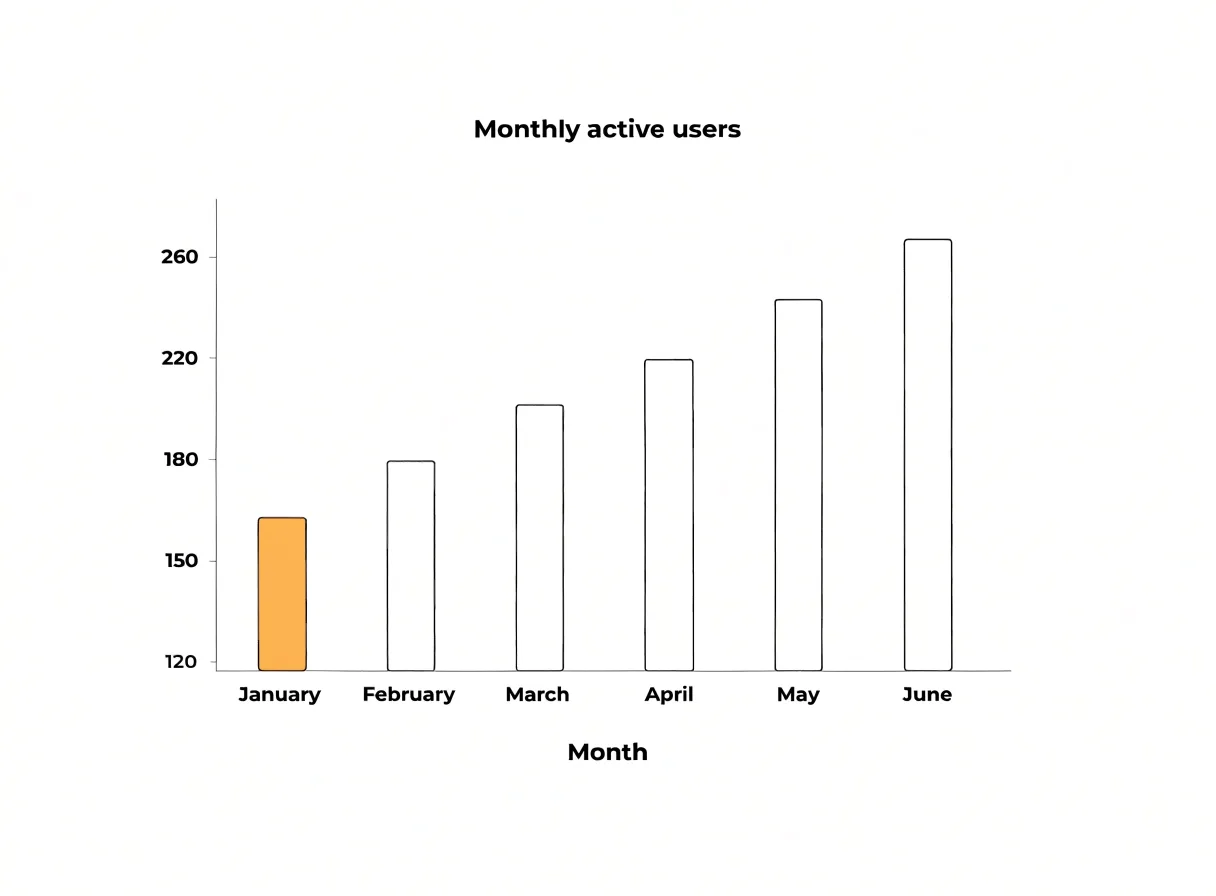
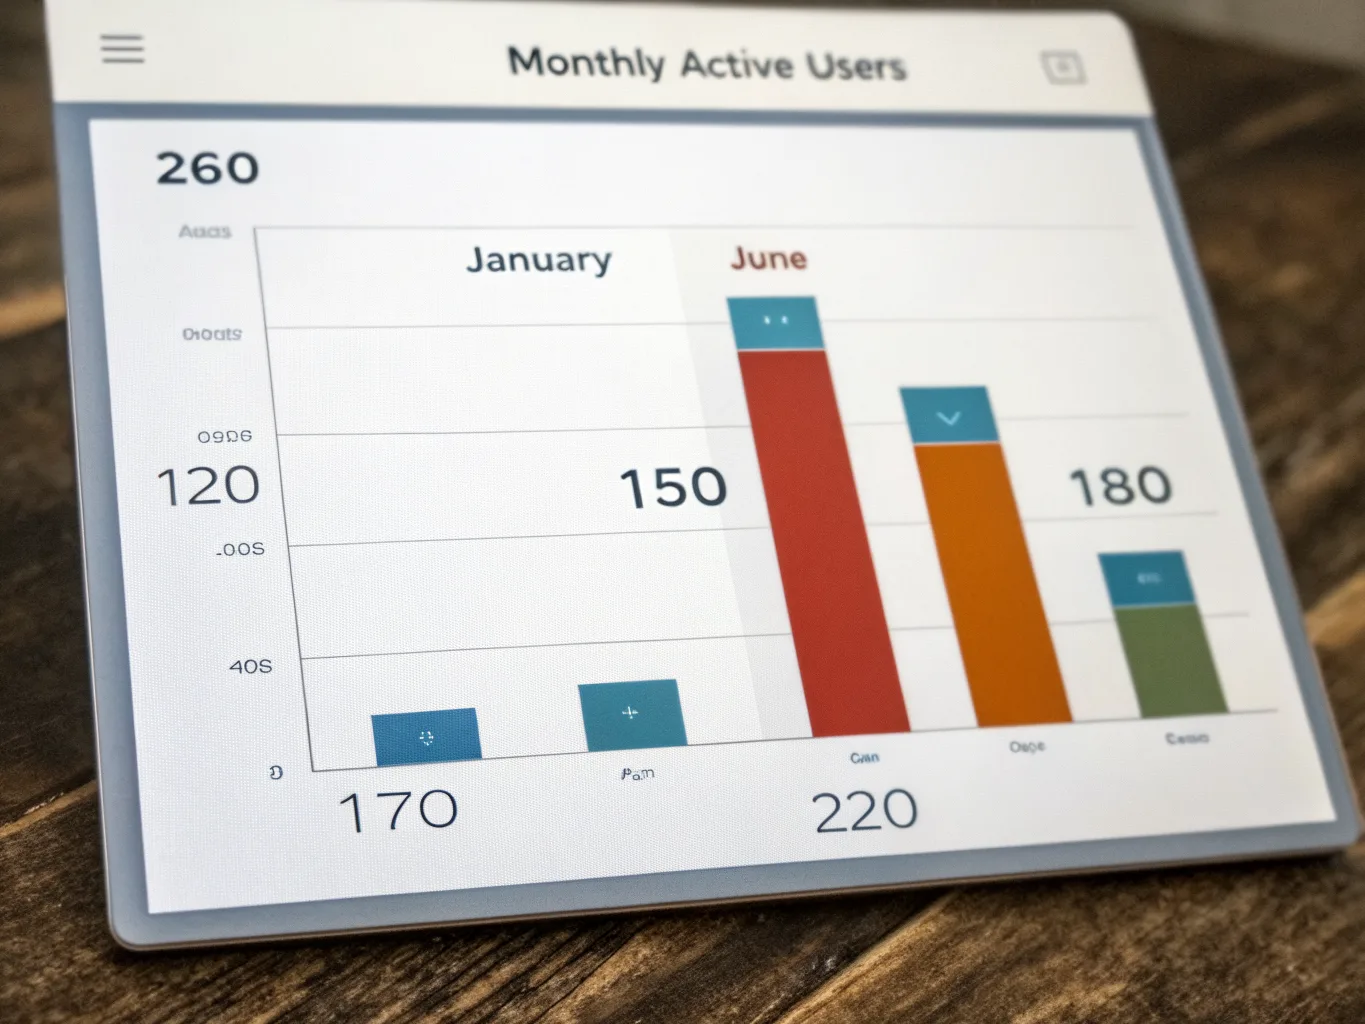
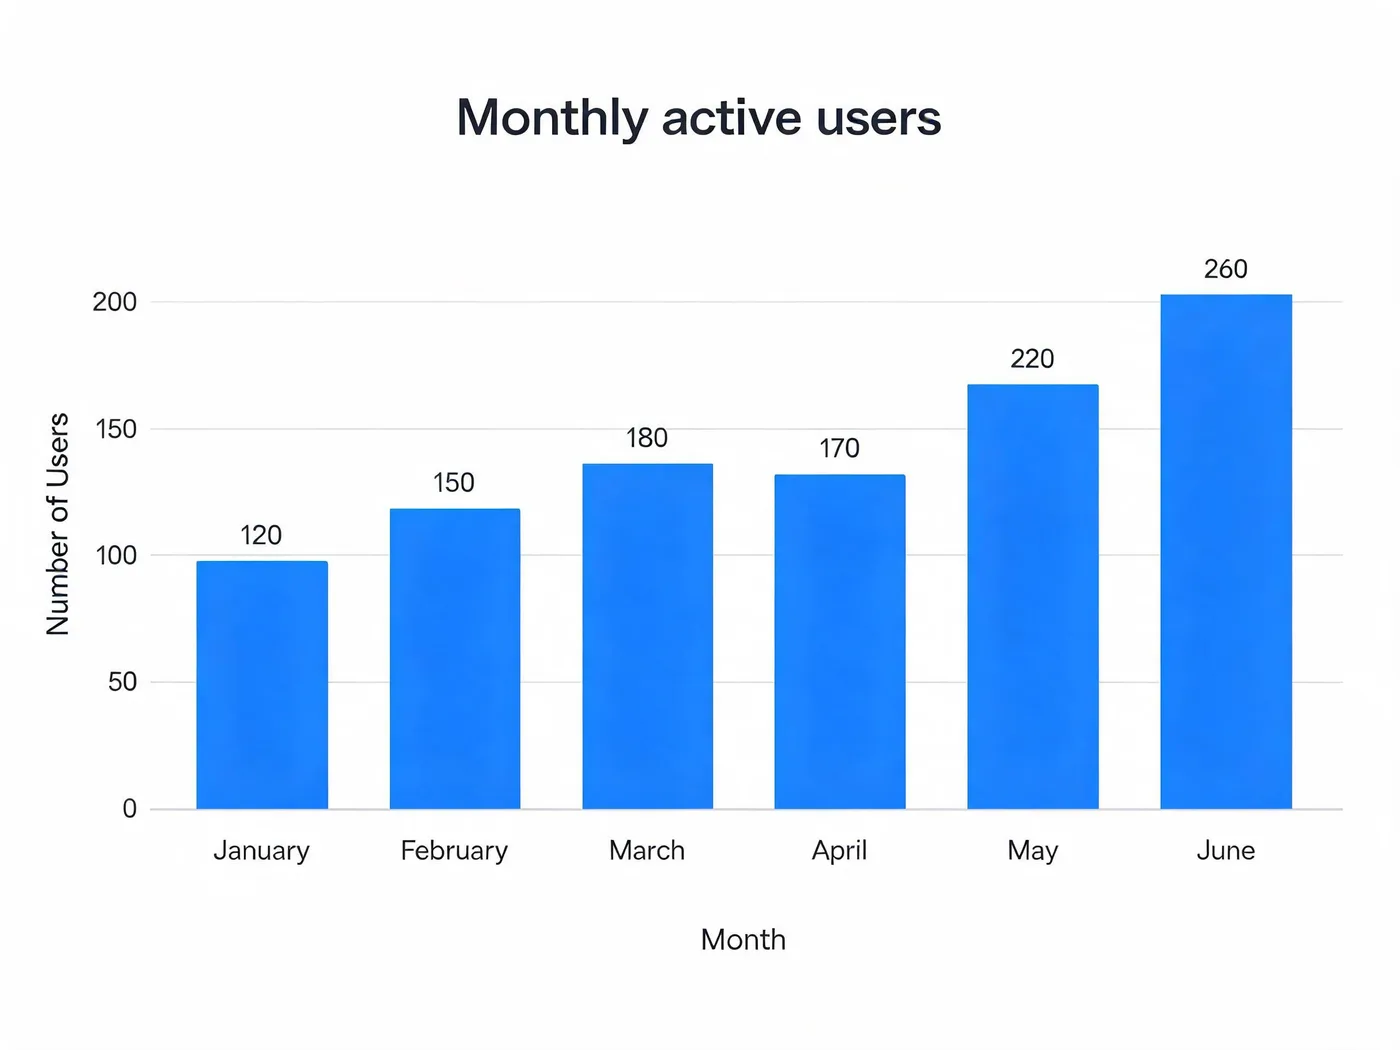
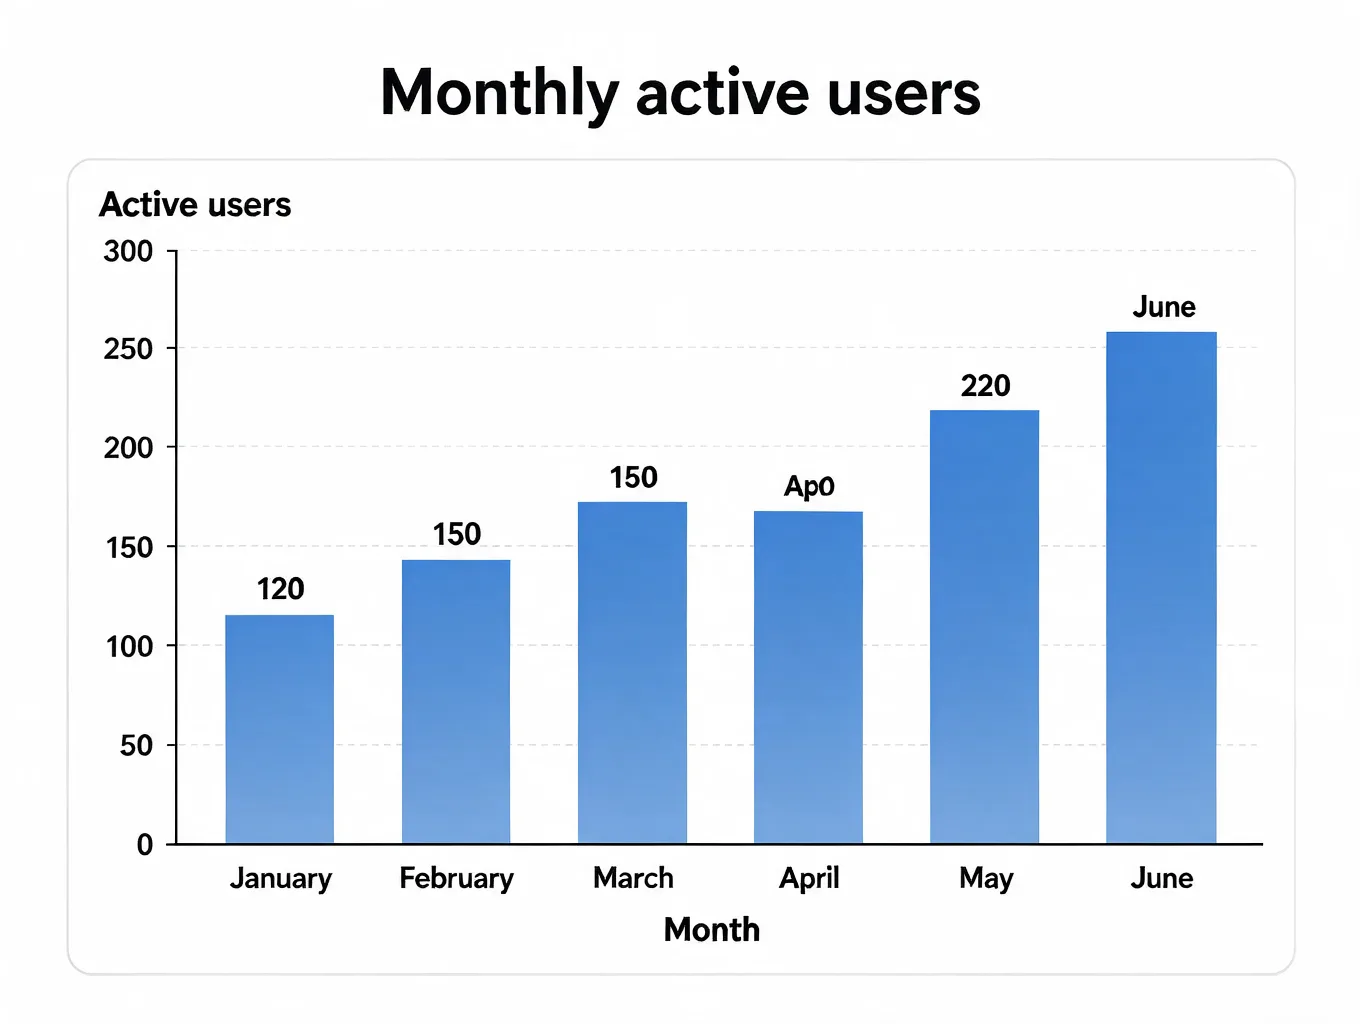
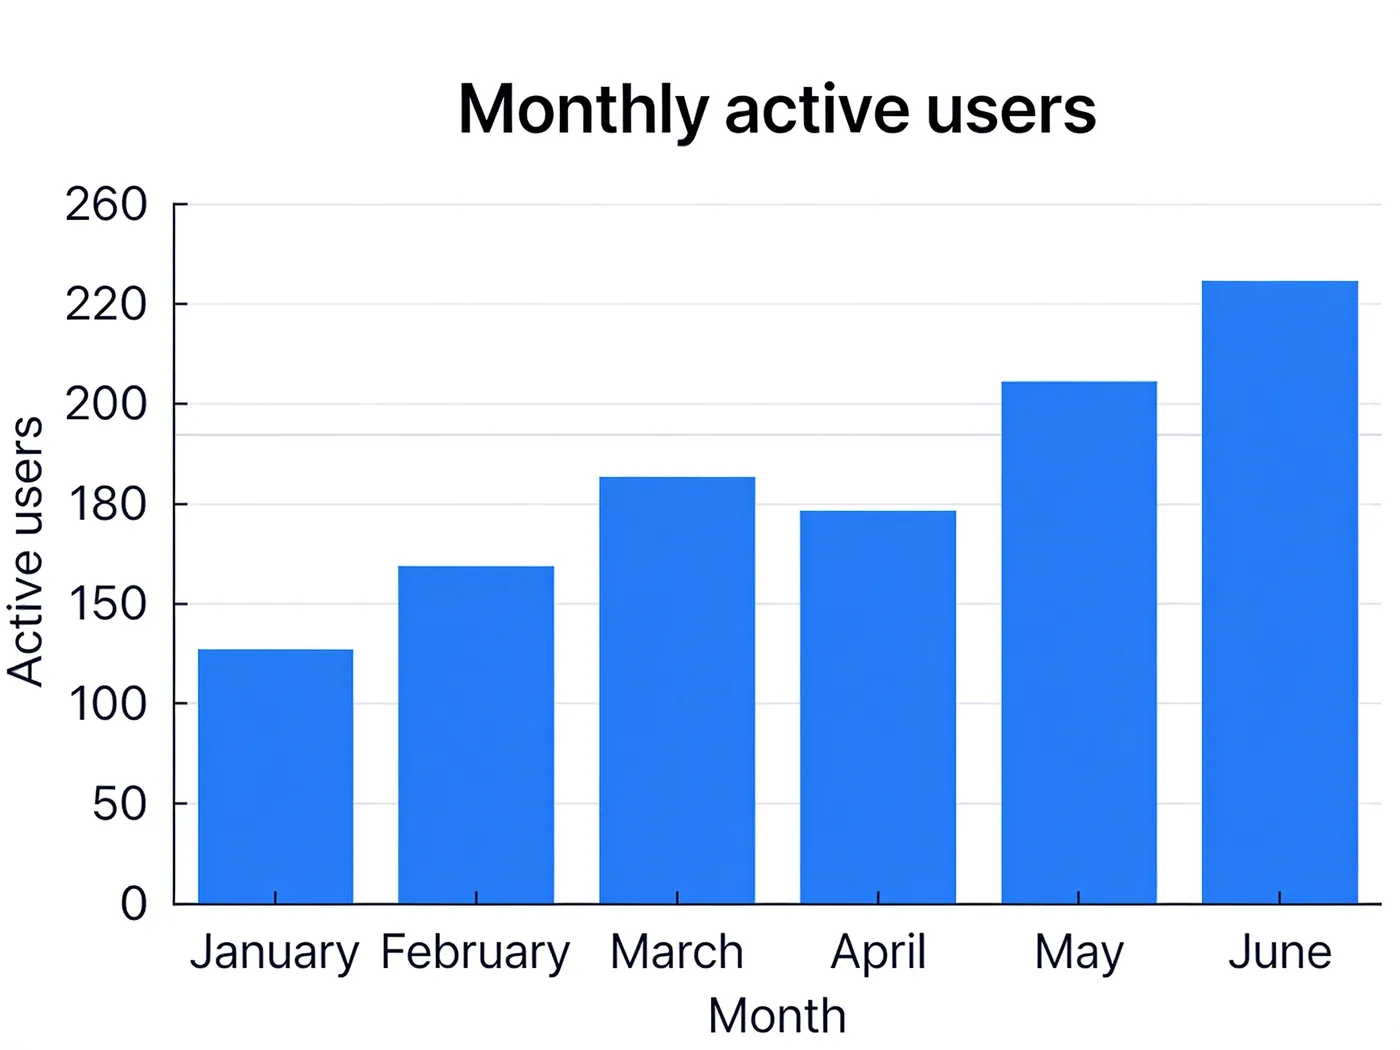
Nano Banana Pro, GPT Image 2.5 Flare and Sunburst, GPT Image 2 and Seedream 5.0 Pro drew the chart correctly: right values, right months, sensible axis. The failures are worth reading: Ideogram 4.0 inverted the y-axis, Recraft V3 photographed a tablet with a chart on it, Grok Imagine 1.0 labelled two bars June, FLUX.2 Flex and Pro dropped or reordered months, and Nano Banana 2 Lite added 'k' to every value. Qwen-Image got the bars right and garbled the month labels; HiDream-I1 returned a table with invented numbers. FLUX 3 Image, added in October, printed every value and month correctly, but on bars whose heights do not match its own axis. Ideogram 4.5, added on 22 October, printed all six values correctly over bars that do not match them: April's 170 stands taller than March's 180. MOSS-Image, added on 22 October, drew the chart correctly, values, months and bar heights, after its layout planner wrote a box for every bar. None of the other eight 22 October additions did: Krea 3's axis reads 0, 100, 200, 200, 0, Seedream 5.0 Flash labelled April 'Ap0', Recraft V4.1 Flash's axis is the data values themselves, and Bria FIBO 2.0's bars climb past their own axis. Ideogram Vector draws seven bars for six months and omits the numeric values and vertical scale.
- 1.Nano Banana Pro every value and month correct, with a clean axis.
- 2.GPT Image 2.5 Flare correct data in a tidy teal chart.
- 3.GPT Image 2 correct values and labels.
- 4.Seedream 5.0 Pro right numbers with an axis title.
- 5.MOSS-Image right values, months and bar heights from a planned JSON layout.
Every image model on this prompt, 35 pictures
One try each, nothing re-rolled or retouched, generated by us. Ranked models come first; the rest follow in family order. Open a model for the rest of its set.
›The prompt every model got
A clean bar chart titled 'Monthly active users' showing six months, January through June, with the values 120, 150, 180, 170, 220 and 260, labelled axes, white background, one accent colour, no 3D effects.
Six labelled bars at the stated heights, in order, with readable axes.
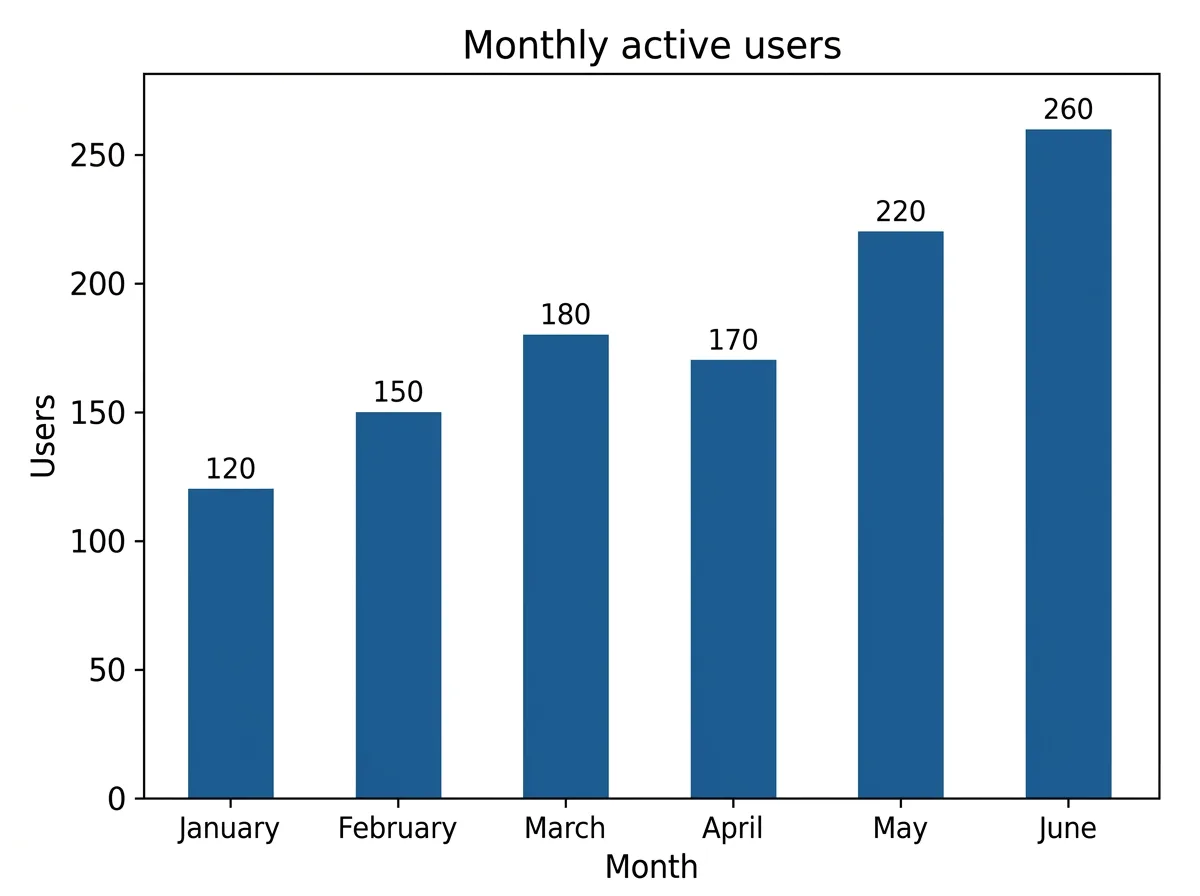
every value and month correct, with a clean axis.
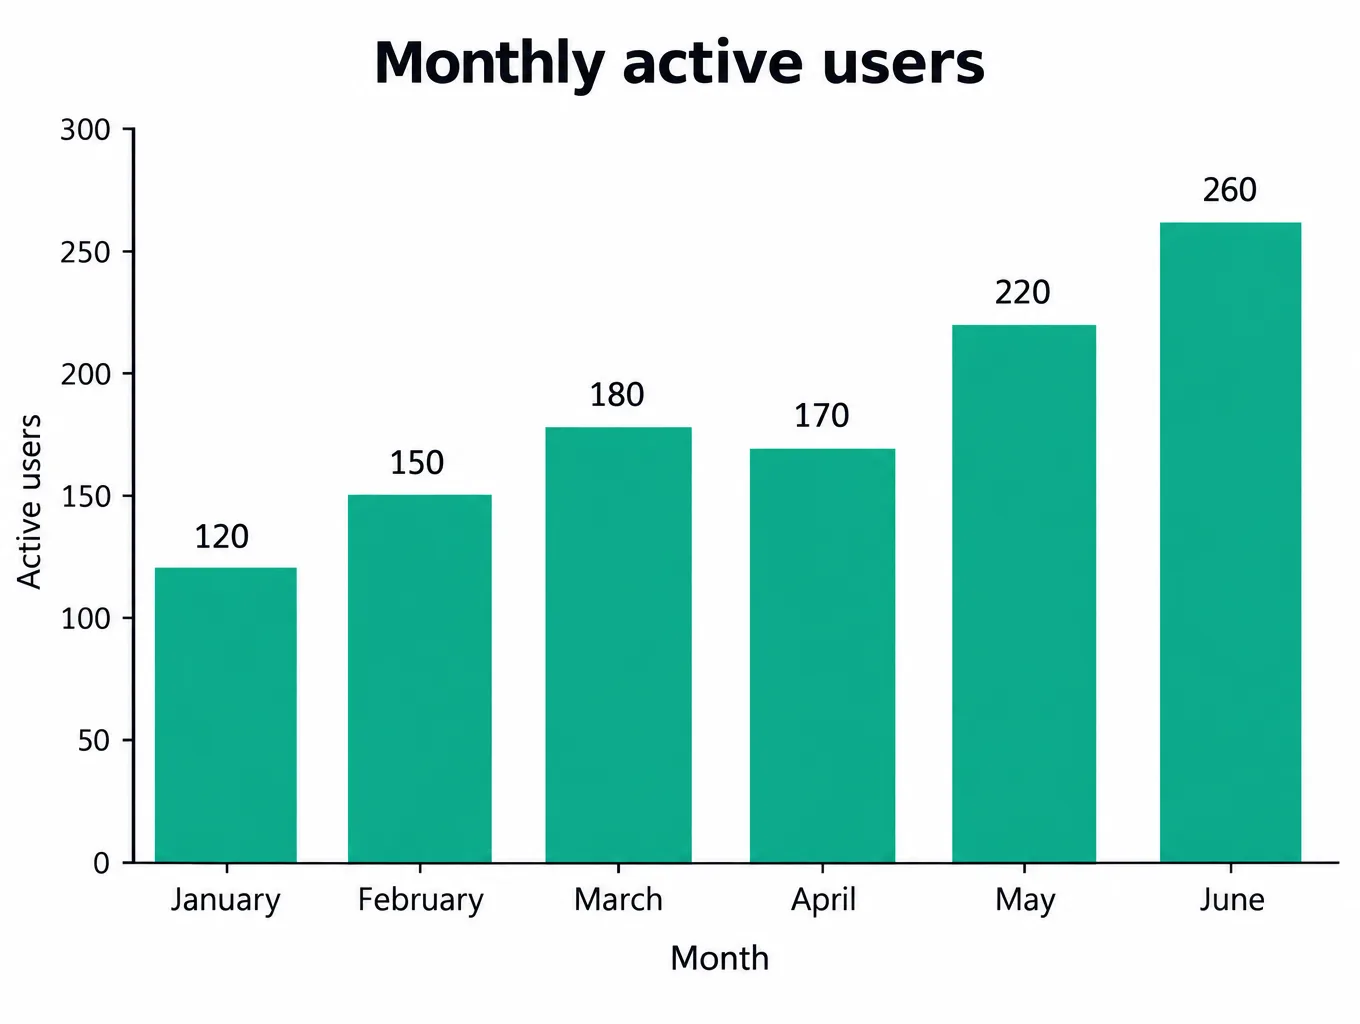
correct data in a tidy teal chart.
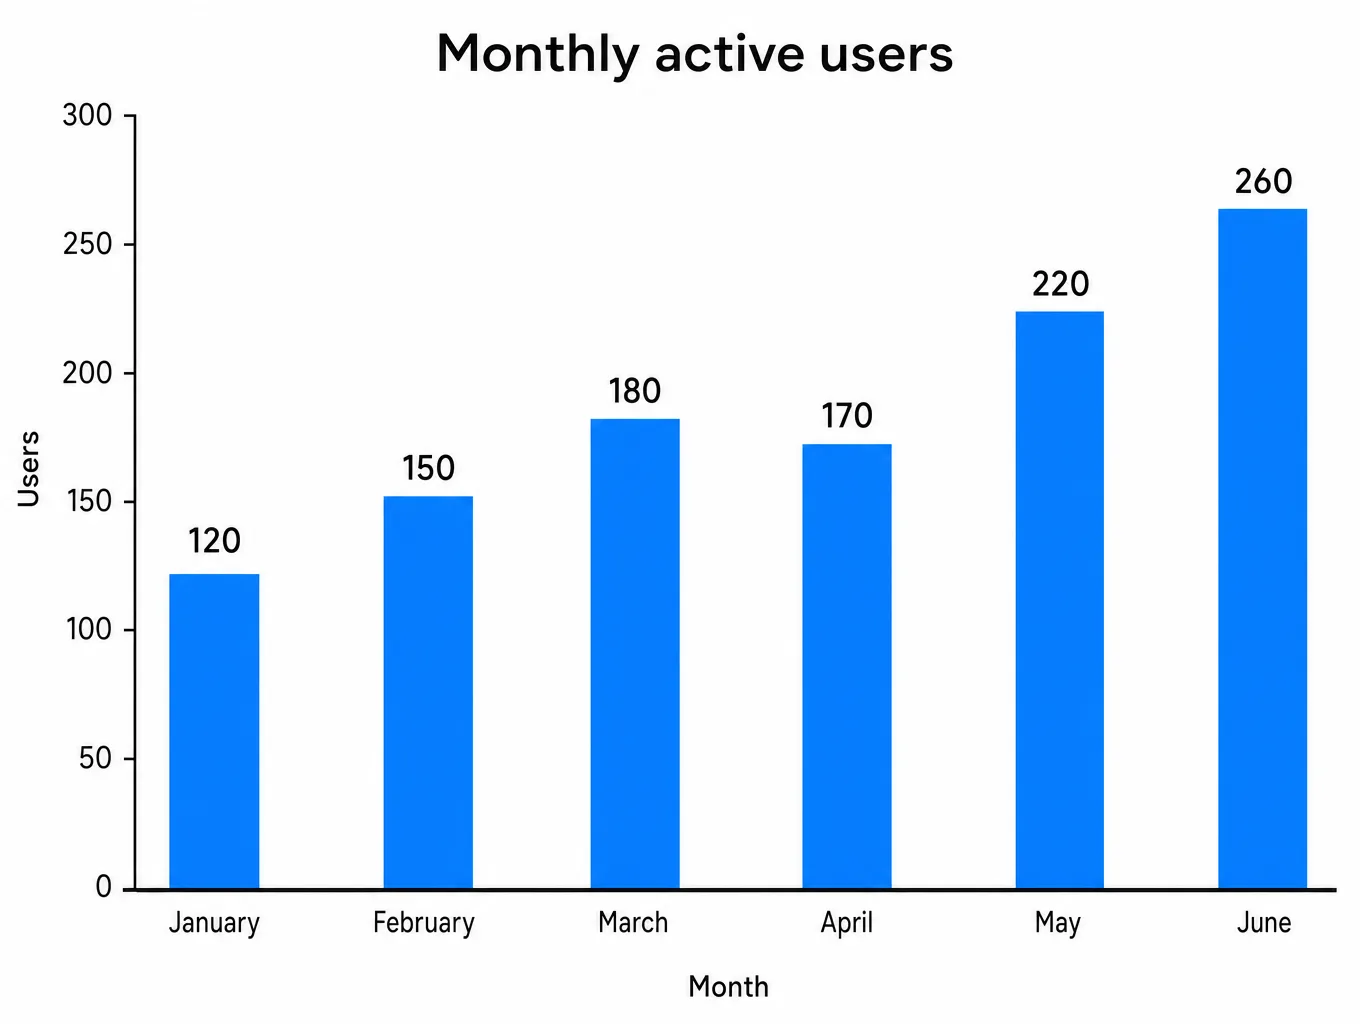
correct values and labels.
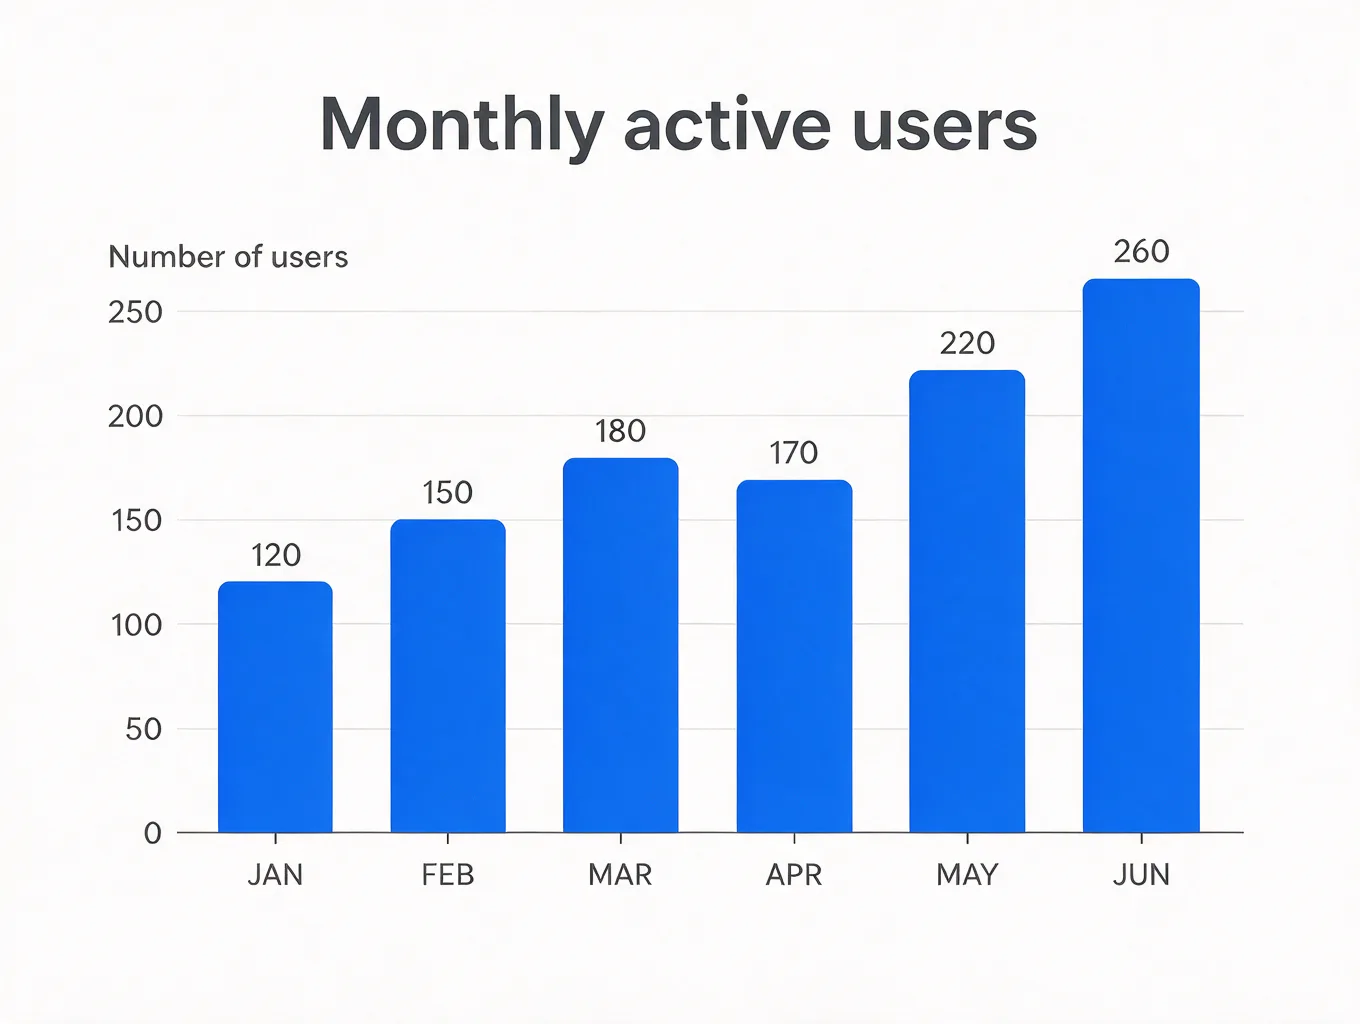
right numbers with an axis title.
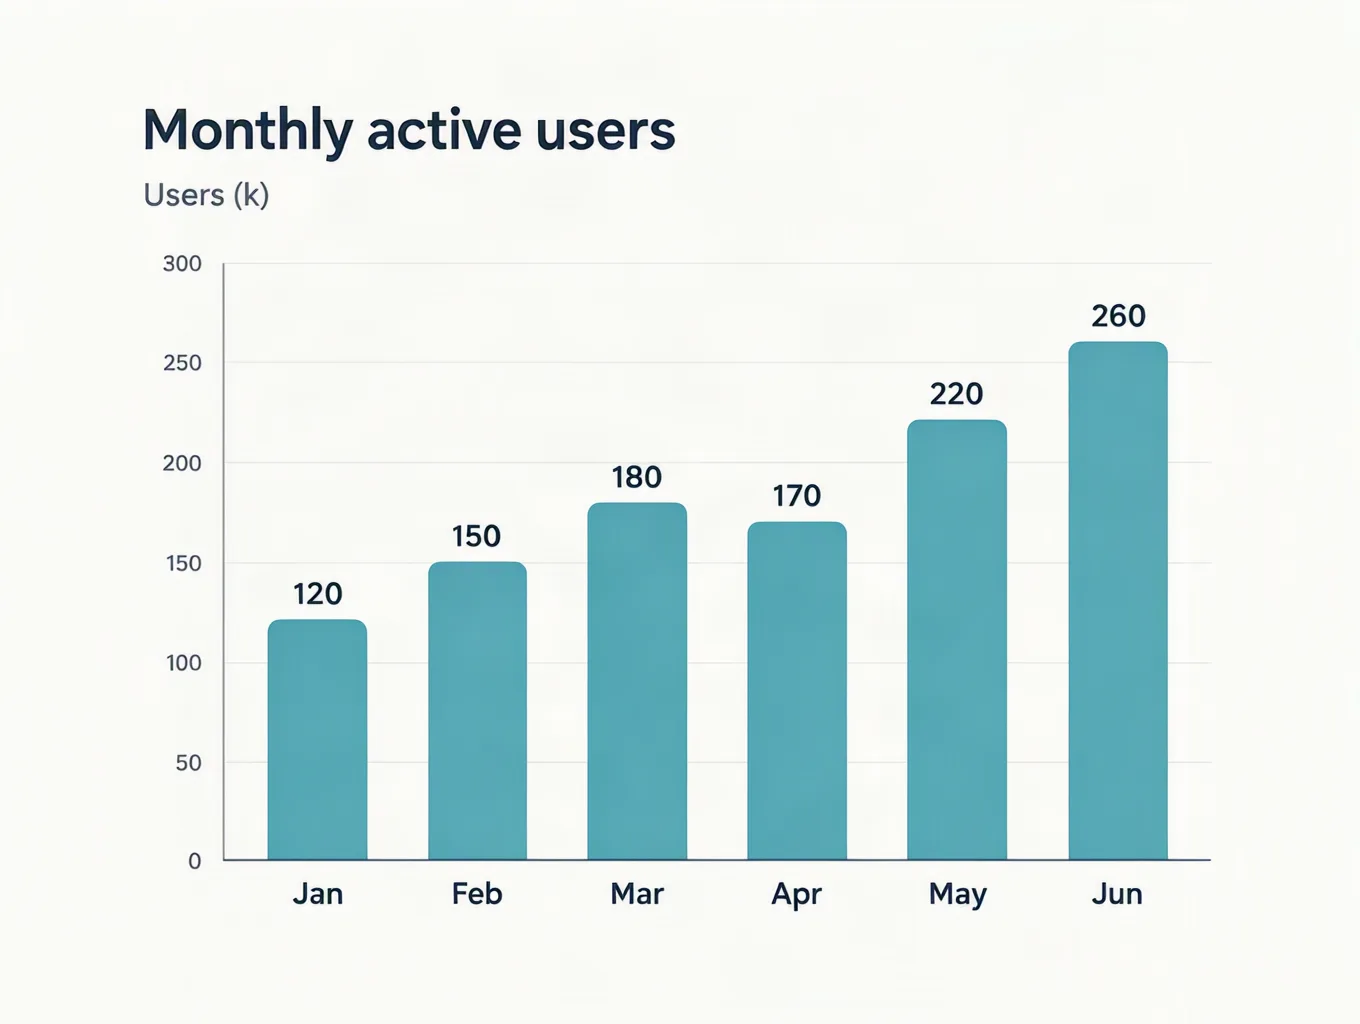
right values, months and bar heights from a planned JSON layout.
The other prompts
- Which AI image model holds an art style
- Which AI image model handles a busy scene best
- Which AI image model edits a picture best
- Which AI image model does faces and hands best
- Which AI image model makes the best food photo
- Which AI image model follows a hard composition
- Which AI image model makes the best infographic
- Which AI image model makes the best logo
- Which AI image model makes the best product shot on white
- Which AI image model renders text best
- Which AI image model makes the best wide banner
Frequently asked questions
Can AI generate an accurate chart?
Some can. Nano Banana Pro, GPT Image 2.5 and Seedream 5.0 Pro reproduced six given values correctly. Several others changed months or units, so check every label, or draw the chart from data in a design tool instead.

Voyager
Run supported models inside Voyager
Voyager is an agent for creative work that runs supported models. Brief it, and it picks the model for the job, makes the thing and hands back something you can edit. Create an account to get started.